

Estimating Soil Organic Carbon Stocks in Fixed Depth and Fixed Mass of Soil
Accurate measures of soil organic carbon (SOC) are useful indicators of soil health and assessment of land management practices such as tillage, no-till and cover crops on carbon sequestration. By tracking changes in SOC stock levels, farmers, land managers, researchers and policymakers can make more informed decisions that promote soil conservation practices, soil health and enhance agricultural sustainability. This factsheet addresses two popular methods used to estimate the SOC stocks: the fixed depth (FD) method and fixed mass (FM, also referred to as equivalent soil mass) method.
The FD method involves taking soil samples or cores up to uniform depth and is used for its simplicity and ease of application. As the name suggests, this method estimates the SOC stocks up to a pre-determined fixed depth. As per the Intergovernmental Panel on Climate Change (IPCC) guidelines, this depth is often limited to 30 cm for SOC estimates, specifically for carbon markets.
The steps to estimate SOC stocks with FD method are:
- The soil core can be divided into different layers or segments of desired thickness to stratify the distribution of SOC in different layers of soil, for example 0-10, 10-20 and 20-30 cm layers.
- Soil organic carbon concentration is determined for each layer of thickness.
- The soil layer mass and volume is used to determine bulk density.
- Soil organic carbon is estimated by multiplying the amount of organic carbon concentration in each layer with its bulk density and converted for area (for example Mg ha-1) using following equation:
SOC (Mgha¯1) = [%OC × pb(Mgm¯³) × d(m) × 10⁴m²ha¯¹]/100 - All layers are added together to determine the SOC stock up to fixed sampling depth.
The FD method relies on the assumptions that soil surface is fixed and the bulk density is uniform across the sampling space and at different sampling times. However, bulk density and soil surface are dynamic in nature and can vary with time and space (Figure 1). The soil surface and bulk density can change due to deposition or erosion of material (such as soil or organic matter), drainage of wetlands, swelling and compaction which may lead to over or underestimation of SOC stocks (readers are referred to PSS 2287 for more information on dynamic nature of BD). Bulk density can also be influenced by the soil sampling probes (readers are referred to PSS 2288 for more information). These assumptions can create inaccurate SOC stock estimates making FD sampling inconsistent especially when detecting change in SOC stocks for different residue and soil management practices.
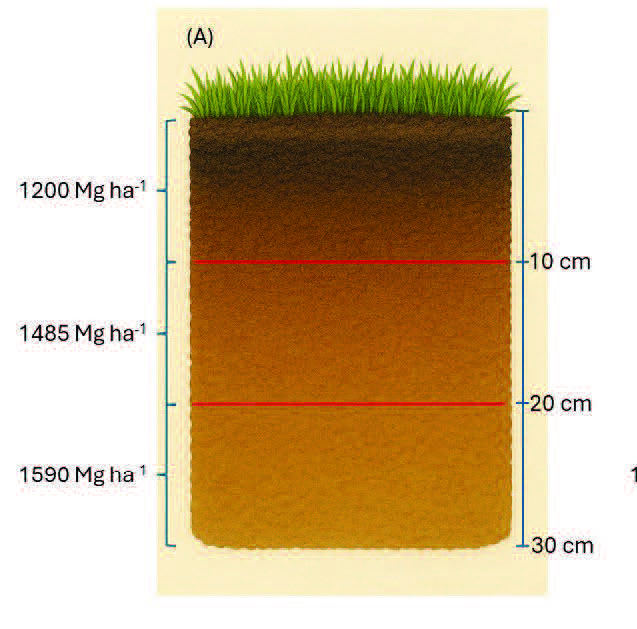 Figure 1a.
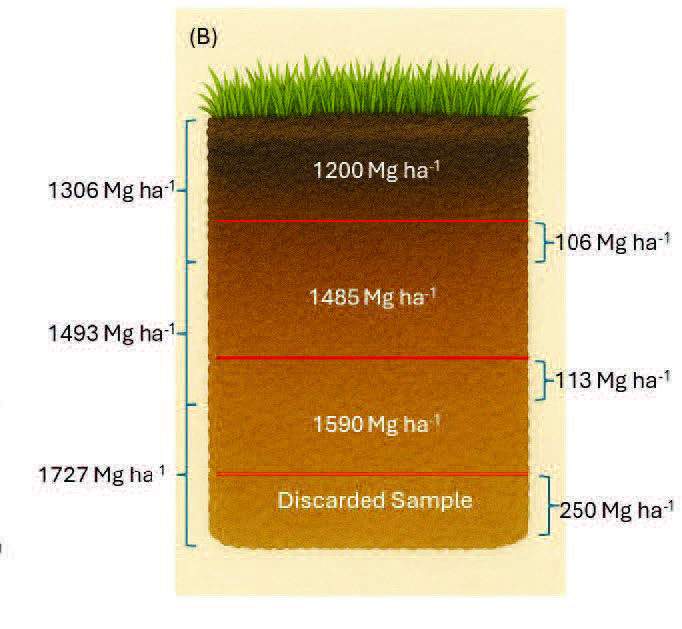 Figure 1b. Example of shifting soil segments to adjust soil mass equal to fixed mass.
As an alternative to the FD method, the fixed mass (FM) method measures SOC stocks in a fixed mass of soil, instead of measuring SOC in volume of soil in a fixed depth. Just like in FD method, samples are taken up to a fixed depth in FM method. The minimum or maximum soil mass across the samples for a given layer is used as fixed mass for that layer. The soil mass in corresponding layers of other cores is adjusted to this fixed mass. This can be explained with the following example:
Figure 1 shows two cores from same field within 3 m radius from each other. Core A represents the fixed soil mass of 1200, 1485 and 1590 Mg ha-1 in 10 cm thick volume of top, middle and bottom layer of soil on 1 hectare land. Core B on the other hand has 1306, 1493 and 1727 Mg ha-1 with organic carbon concentration of 0.263%, 0.134%, and 0.037% in top, middle and bottom layer, respectively. The mass in each layer of core B must be adjusted to fixed mass of core A. Therefore, 106 Mg ha-1 soil is removed from top layer in core B and added to middle layer to bring top layer mass to 1200 Mg ha-1. Now the middle layer soil mass is 1599 (1493+106) Mg ha-1, which is 114 Mg ha-1 greater than the fixed mass of 1485 Mg ha-1 for this layer. The extra 114 Mg ha-1 from middle layer is removed and added to the bottom layer which makes it 1841 Mg ha-1 soil mass. Finally, 251 Mg ha-1 soil is discarded from bottom layer to bring soil mass to 1590 Mg ha-1 for this layer. Because the mass of each layer is fixed, the total soil mass for all layers remains constant, which is 4275 Mg ha-1 in this case. It should be noted that since each layer had its own organic carbon concentration, the added soil mass from top layer must be multiplied by its corresponding concentration.
The final equation for estimating organic carbon stock for core B will be:
- Layer 1 SOC (Mg ha¯¹) = (1200 × 0.263)/100
- Layer 2 +[(1493 × 0.134) + (106 × 0.263) - (114 × 0.134)]/100
- Layer 3 +[(1727 × 0.037) + (114 × 0.134) - (251 × 0.037)]/100
This example demonstrates when minimum soil mass in each layer is used as a fixed mass. If one chooses to use the core with maximum soil mass as ESM, then extra/deeper core sample should be collected to add to the mass from bottom cores to bring mass in top cores to maximum fixed mass. The soil organic carbon stocks are estimated in soil mass of individual layers and added together to obtain stocks in fixed soil mass.
To summarize the steps to estimate SOC stocks with FM method are:
- Samples are taken up to fixed depth or more and segmented into the desired layers.
- Bulk density in each core is calculated, which is used to calculate the soil mass in each layer.
- Fixed mass is selected across the cores using core with either minimum or maximum soil mass.
- Soil mass in all other cores is adjusted to bring it to fixed mass value.
- SOC concentration is multiplied with soil mass in corresponding layer and added together as described in the equations above.
A study conducted by Wilson (2011) in Oklahoma showed significant changes in SOC using FD methods in just 18 days due to changes in bulk density. However, FM method resulted in no significant change in the SOC during this period of time. In another study conducted in Oklahoma by Sharma et al. (2013), minimum soil mass among all the cores was used as FM. In this study, all samples were taken up to 30 cm and segmented in 0-10, 10-20 and 20-30 cm segments. The samples were taken with three different cutting edged diameter probes. Organic carbon concentration was measured in each segment. The SOC stock in extra soil mass from the top layers was added to bottom layers, and extra mass frotm bottom layer was discarded to keep overall minimum soil mass. The SOC concentration was assumed to change from layer to layer in a linear way.
In Sharma et al.’s data, different probes generated different bulk density estimates (PSS 2288) within a 3-meter radius area, some fields showed statistically significant differences among bulk density measured with different probes. Figure 1 shows SOC stocks estimated up to 30 cm in this study for samples taken with three different sampling probes using FD and FM method using minimum mass. The three probes gave significant differences in SOC stocks in five out of 19 fields (p<0.05), whereas the FM method restricted the significant differences to two out of 19 fields (Figure 2). Variation in bulk density measurements from probe can contribute significantly to the estimates of SOC stocks. A negative correlation of SOC concentrations with bulk density in this study further highlighted biasedness of FD method in SOC stock estimate as the bulk density declines with ac-cumulation of SOC concentration thereby underestimating the SOC stock in soil (Eq. 1). The FM method, although improved variation in SOC stock estimates among probes, it failed to bring coherence among the probes as it reduced the average variation in SOC stocks among the probes by only 1.8% (Figure 2). In fact, the FM method increased the average variation by 16% in SOC stocks among probes in four out of 19 fields. However, the variation was reduced among probes by 45% in other fields ranging from 10 to 79% in individual fields (Figure 2). It should be noted that while the FM method eliminates the error caused by bulk density, yet it does not eliminate the variation in SOC concentration in each core. Further, FM still requires bulk density to measure soil mass and the mass in individual layers is not fixed, which can still introduce profound influence of BD on SOC stock through soil mass of individual layers. For FM method to be successful in observing changes in SOC overtime, the FM value must be similar for different sampling time to estimate true change in SOC stocks.
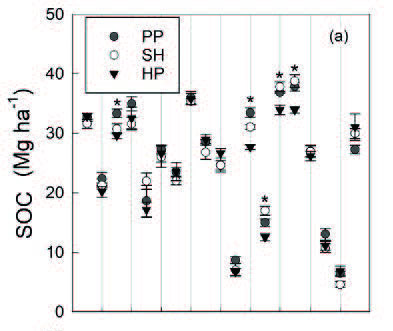
Figure 2a.
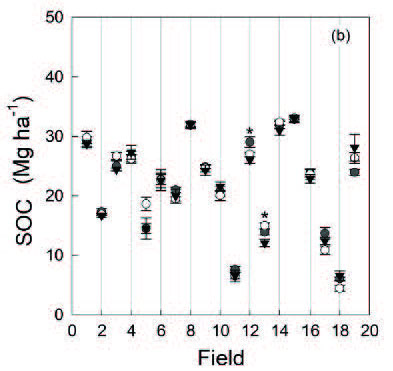
Figure 2b. Cumulative soil organic carbon (SOC) stocks in push probe (PP), slide hammer probe (SH) and hydraulic probe (HP) samples for (a) fixed depth (FD) of 30 cm and (b) fixed mass (FM). Astericks in plots (a) and (b) denote fields with significant probe impact (p<0.05).
Calculation methods or sampling equipment may not be the only potential sources of error in SOC stock estimations. Both FM and FD methods use linear interpolation for changes in SOC concentration with depth of soil i.e. the SOC concentration changes abruptly from one segment to the other in different segments of similar soil core. One way of eliminating this uncertainty could be by avoiding segmentation of the core and using mass and SOC concentration in an intact core (thereby homogenizing SOC concentration in soil mass) to estimate SOC. This method will be based on the assumptions that SOC concentration is well homogenized during the processing of the soil sample. Factors such as gradual versus abrupt changes in SOC as a depth function can have potential affects on these measurements as well and need to be studied. Recent study by Souza et al. has shown gradual change in SOC concentration for each 2.5 cm segment between 0-15 cm depth soil layer. Furthermore, measurement of core depth, removing plant residue from the surface before sampling, time of the sampling and management history of land can add to uncertainties related to quantifying SOC stocks. More research will be needed to compare this approach with FD and FM methods.
References
Souza, J.L.B., J.A. Antonangelo, H. Zhang, V. Reed, B. Finch, B. Arnall. 2023. Impact of long-term fertilization in no-till on the stratification of soil acidity and related parameters. Soil and Tillage Research 228: 105624. Available at: https://doi.org/10.1016/j.still.2022.105624
Sharma, S., T. Wilson, T. Ochsner, J.G. Warren. 2020 Sampling probes affect bulk density and soil organic carbon measurements. Agricultural & Environmental Letters. doi: 10.1002/ae12.20005
Wilson, T.M., J.G. Warren. 2015. Bulk density and carbon concentration variance influence on soil carbon stock measurements. Communications in Soil Science and Plant Analysis, 46, 2342-2356.t
Sharma, S., J. Warren. 2024. Basics of Soil Bulk Denisty. PSS-2287. Oklahoma Cooperative Extension Service. Available at: https://extension.okstate.edu/fact-sheets/basics-of-soil-bulk-density.html
Sharma, S., J. Warren, T. Ochsner, C. Diggins. 2025. Bulk density estimates with different soil sampling probes, soil textures and soil moisture conditions. PSS-2288. Oklahoma Cooperative Extension Service. Available at: https://extension.okstate.edu/fact-sheets/bulk-density-estimates-with-diferent-soil-sampling-probes-soil-textures-and-soil-moisture-conditions.html