

Agribusiness Management Series Oklahoma Canola Systems vs. Continuous Wheat Budget Comparison
The Oklahoma Canola Systems vs. Continuous Wheat Budget Comparison was developed to assist producers project returns from canola systems in comparison to continuous wheat. The program is a joint project of the Department of Agricultural Economics and the Department of Plant and Soil Sciences at Oklahoma State University. The program can be downloaded from: http://www.agecon.okstate.edu/faculty/publications.asp (Author: DeVuyst; Type: Spreadsheet).
The program will work best in MS Excel 2007, but will also run on MS Excel 2003, if the user has downloaded and installed conversion software from Microsoft. Some loss of functionality may be observed in MS Excel 2003. For the program to function properly, the user must allow the macro features of MS Excel. In MS Excel 2007, the user is prompted with a warning just below the button bar that macros have been disabled. Click on the warning and enable macros. In MS Excel 2003, the user must change the security level to medium or low to enable macros.
Table 1. Data requirements
Scenario name | C | Roundup-Ready Canola-Wheat-Wheat | |
|---|---|---|---|
Scenario name | Load defaults | Wheat defaults | Canola defaults |
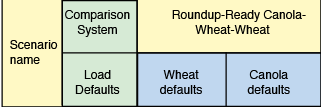
Cells in yellow allow for user input. Cells in green or blue are either display or calculated cells. Green and blue cells are protected to prevent users from accidentally overwriting equations.
The top table of the program allows users to enter a description e user also specifies the canola system to be considered. Either conventional canola or Roundup-Ready of the scenario to be evaluated and the current date. These cells are optional. Thcanola systems can be analyzed.
The first table also allows the user to load defaults on yields, prices, and input use and prices for wheat and canola rotations. These defaults were developed by OSU canola researchers. Since these values will vary by location and producer, they should be used to guide the user in developing budgets. Location and producer specific values should be entered when available.
Table 2 data requirements
As in Table 1, user-supplied data are entered into yellow-shaded cells. The top of Table 2 requires the user to specify units of measurement for wheat (except in unusual cases, bushels) and canola (usually pounds or bushels), prices for wheat and canola, and expected yields for both crops. Note: wheat yield may vary by cropping system/rotation.
On left side of the middle of Table 2, inputs are listed. The cells labeled as seed, fuel, lubrication, financing and harvest costs cannot be changed. Other inputs labels can be defined by users.
To help organize user-entered inputs, the defaults are listed in three blocks: fertilizers, herbicides, other pesticides and crop insurance. The user must supply the purchase prices of each input. For each crop and system, the user must enter the quantity of each input entered in the left-hand column.
Interpreting results
The results on the bottom of Table 2 report “cash returns” or returns to land, labor, machinery, overhead and management. The budgets include fuel, lube, repair, harvest costs, fertilizer, herbicide, insecticide, and fungicide application. Since the same machines may be used to till and plant, unlisted machinery costs are not likely to be substantially different across systems. However, at least initially, canola will require an investment in learning how to grow the crop. This additional cost for management is not included in the canola budget. The wheat budgets are for grain-only rather than for dual-purpose wheat. To evaluate dual-purpose wheat, the budgets could be modified by adjusting the levels of wheat yield, nitrogen and seed, and including the net value of grazing. In preliminary comparisons, a canola plus two years of dual-purpose wheat rotation generates more expected net returns than three years of continuous dual-purpose wheat.
Table 2.
| Production System | |||||||||
| Revenue | Unit of mesure | Price Per unit | Continuous Wheat | Roundup-Ready Canola- Wheat- Wheat | |||||
WHEAT | WHEAT | WHEAT | WHEAT | CANOLA | CANOLA | ||||
| Production | Yield | Revenue | Yield | Revenue | Yield | Revenue | |||
| Wheat | bu | $5.00 | 40 | $200.00 | 43 | $215.00 | Xxx | xxx | |
| Canola | lb | $0.15 | xxx | xxx | xxx | xxx | 1800 | $270.00 | |
| Gross Returns | acre | $200.00 | $233.33 | ||||||
| Cash Costs | Quantity | Cost | Quantity | Cost | Quantity | Cost | |||
| Wheat Seed | bu | $5.00 | 1 | $15.00 | 1 | $15.00 | xxx | xxx | |
| RR Canola Seed + Fees + Treatment | lb | $5.25 | xxx | xxx | xxx | xxx5 | $26.25 | ||
| Anhydrous Ammonia (82-0-0) | lb | $0.20 | 68 | $13.60 | 76 | $15.20 | 0 | $ – | |
| Fertilizer Application | acre | $12.00 | 1 | $12.00 | 1 | $12.00 | 0 | $ – | |
| Urea (46-0--0) | lb | $0.19 | 0 | $ – | 0 | $ – | 143 | $27.17 | |
| DAP (18-46-0) | lb | $0.21 | 50 | $10.50 | 50 | $10.50 | 50 | $10.50 | |
| Sulfur (0-0-0-90S) | lb | $0.40 | 0 | $ – | 0 | $ – | 5 | $2.00 | |
| Fertilizer Application | acre | $4.00 | 1 | $4.00 | 1 | $4.00 | 2 | $8.00 | |
| Herbicide (broadleaf) | acre | $5.00 | 1 | $5.00 | 1 | $5.00 | 0 | $ – | |
| Herbicide (grass) | acre | $16.00 | 1 | $16.00 | 1 | $16.00 | 0 | $ – | |
| Herbicide Select® | oz | $0.92 | 0 | $ – | 0 | $ – | 0 | $ – | |
| Herbicide Assure II® | oz | $1.15 | 0 | $ – | 0 | $ – | 0 | $ – | |
| Crop Oil Concentrate | Acre | $1.00 | 0 | $ – | 0 | $ – | 0 | $ – | |
| Roundup PowerMax | oz | $0.48 | 0 | $ – | 0 | $ – | 36 | $17.28 | |
| Herbicide Additive (ams) | lb | $0.13 | 0 | $ – | 0 | $ – | 2 | $0.25 | |
| Herbicide Application | acre | $4.00 | 2 | $8.00 | 2 | $8.00 | 2 | $8.00 | |
| Prosper FX® | acre | $6.00 | 0 | $ – | 0 | $ – | 0 | $ – | |
| Insecticide dimethoate | pint | $5.38 | 0.75 | $4.04 | 0.75 | $4.04 | 0 | $ – | |
| Warrior® Fall (1 of 3 yrs) | oz | $2.45 | 0 | $ – | 0 | $ – | 1 | $2.45 | |
| Insecticide (e.g. Warrior®) Spring | oz | $2.45 | 0 | $ – | 0 | $ – | 3 | $7.35 | |
| Foliar Fungicide (1 of 3 years) | acre | $12.50 | 0.33 | $4.13 | 0.33 | $4.13 | 0 | $ – | |
| Aerial Pesticide Application | acre | $5.00 | 1.33 | $6.65 | 1.33 | $6.65 | 1.33 | $6.65 | |
| Wheat Crop Insurance | acre | $6.70 | 1 | $6.70 | 1 | $6.70 | xxx | xxx | |
| Canola Crop Insurance | acre | $12.50 | xxx | xxx | xxx | xxx | 1 | $12.50 | |
| Fuel | gal | $2.00 | 4.92 | $9.84 | 4.92 | $9.84 | 4.92 | $9.84 | |
| Lube | acre | $1.48 | 1 | $1.48 | 1 | $1.48 | 1 | $1.48 | |
| Repair | acre | $7.12 | 1 | $7.12 | 1 | $7.12 | 1 | $7.12 | |
| Operating loan interest rate | % | 7.00% | $62.03 | $4.34 | $62.83 | $4.40 | 73.42 | $5.14 | |
| Wheat Custom Harvest & Hauling | |||||||||
| Base Charge | acre | $16.00 | 1 | $16.00 | 1 | $16.00 | xxx | xxx | |
| Excess for > 20 bu/a | bu | $0.23 | 20 | $4.60 | 23 | $5.29 | xxx | xxx | |
| Hauling | bu | $0.23 | 40 | $9.20 | 43 | $9.89 | xxx | xxx | |
| Canola Custom Harvest & Hauling | |||||||||
| Swathing or Pushing | acre | $12.00 | xxx | xxx | xxx | xxx | 1 | $12.00 | |
| Combining | acre | $16.00 | xxx | xxx | xxx | xxx | 1 | $16.00 | |
| Excess for > 20 bu/a | bu | $0.23 | xxx | xxx | xxx | xxx | 16 | $3.68 | |
| Hauling | bu | $0.23 | xxx | xxx | xxx | xxx | 36 | $8.28 | |
| Total "Cash" Costs | acre | $158.19 | $161.23 | $191.94 | |||||
| Net Returns to Land, Machinery Fixed Costs, Labor, Overhead and Management | acre | $41.81 per acre | $61.87 per acre Roundup-Ready Canola-Wheat-Wheat | ||||||
Eric A. DeVuyst
Associate Professor, Farm Management and Production Management
Francis Epplin
Professor, Agriculture Business and Commercial Agriculture
Thomas F. Peeper
Professor, Weed Control, Small Grains
Mark C. Boyles
Assistant Extension Specialist