

Ag Insights - October 2026
Friday, October 23, 2026
Controlling Grassy Weeds in Wheat
Josh Bushong, Area Extension Agronomist
Wheat sowing season has officially started in the area. While most farms are still deficient in soil moisture, if wheat pasture is desired early establishment is key. Managing weeds in both dual-purpose and grain-only wheat systems always starts with “clean” fields. I much rather receive a few rains prior to sowing wheat to not only build up soil moisture reserves, but also to sprout early weed flushes to more easily control them before the crop with burndown herbicides or final tillage passes.
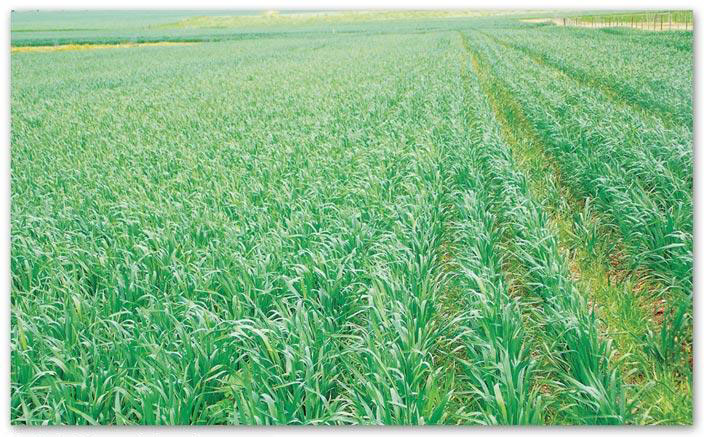 Figure 1. Undesirable weeds in wheat crop.
Prolonged drought and heat cause many issues. Summer weeds have been much more difficult to control with herbicides. Many species develop thicker cuticles preventing herbicide adsorption. Stressed plants also behave more like a dormant plant with cell functions being greatly reduced, which reduces herbicide activity in the plant as well.
Weeds have a substantial economic impact on growing wheat for grain. Direct plant competition with the crop and price implications for dockage and foreign material at the elevator both can impact us. Weeds also can impact a field for years to come. Fall herbicide applications have historically proven to save the most grain yield and provide the best return on investment.
Delayed planting, or more specifically late germination and emergence in a dry year like this, will also likely result in delayed emergence of weeds. If this happens, then deferring herbicides until early spring will likely be the main option. Late fall and early spring herbicide application timings need to be determined by both the growth stage and growing conditions of the crop and weeds.
Herbicide options also depend on whether you are growing conventional wheat or one of the two herbicide-tolerant trait systems. These two systems are Clearfield (Beyond herbicide) and CoAXium (Aggressor AX herbicide). If the wheat continues to have drought stress and the weeds are remaining small this fall, I would defer to focusing just on a spring herbicide application using the max single-season rates.
The Aggressor AX herbicide label was updated earlier in 2026 which increased the max single-use rate to 16 fluid ounces per acre. The max per year is also limited to 16 fluid ounces, so if fall applications are made use 8 to allow the option to follow up in spring with another 8 fluid ounces.
Italian ryegrass continues to gain more acreage year after year. Most of the past decade populations have been centered along the highway 81 corridor, but now I’m seeing it further west from Altus to Watonga. Heavy reliance on Axial, a Group 1 type herbicide, has resulted in intensified selection of herbicide resistance.
Widespread Acetolactate Synthase (ALS), Group 2, herbicide resistance was confirmed in 2008 around the time when PowerFlex was hitting the market. Our best recommendation now relies on delayed preemergent herbicides such as Zidua, Anthem Flex, and Axiom (not to be confused with CoAXium).
True cheat is an old enemy of wheat. ALS products such as Outrider (previously named Maverick) and Olympus have been excellent products to keep cheat managed. Unfortunately, these days are numbered. ALS herbicide resistant cheat was first confirmed in Kay county in 2010. Strong suspicion of resistance are continuing to be reported throughout north central Oklahoma.
The herbicide chemical families of Sulfonyurea (SU) and Imidazolinone (Imi) both belong to the ALS herbicide group (same site of action). As such, what we’ve observed is that once cheat becomes resistance to SU products the Imi products, like the herbicide Beyond, will also likely have resistance. Meaning that if the SU herbicides are not controlling the cheat, using Beyond in a Clearfield production system will not work either.
Feral rye was plentiful in all too many wheat fields last year. The Clearfield Plus system has shown improvement with the addition of Metholated Seed Oil (MSO) adjuvants. It’s still be a viable option to greatly suppress rye if used correctly. Sequential applications of 4oz/a of Beyond tank-mixed with MSO and a nitrogen source applied in the fall and spring needed for rye. Applications made prior to the rye reaching the tillering stage usually results in better efficacy and the second application in early spring helps reduce any escapes and the late emerged rye.
Contact your local OSU Extension Educator to discuss weed management options for your operation.
Drought Paired With Poor Forage Conditions Makes Accurate Feeding Even More Important
Dana Zook, NW OK Area Livestock Specialist
Is it safe to say Fall is here? Today will be in the lower 90’s but this is a far cry better than 105, right? Most of NW OK has been blessed with rain in September which has reinvigorated forages across our landscape. As I drove to Woodward, OK last week, I noticed the expanse of intense green. I wondered about the impacts of this rain on fall forage growth; How will this impact hay needs in the short term? Will this alter supplemental need? How much more will forage grow? Luckily, my travels culminated at a Range Management Inservice where I was able to consult our OSU Extension Range Ecologist, Dr. Laura Goodman and I would like to share some thoughts from our discussions that day.
Our in-service training focused on tools to guide producers in stocking rate, management and efficient use of native grasslands. Across Oklahoma, there are 22 million acres of rangelands, 8.7 million of which are native grasslands. This is an essential resource to cattle producers, especially in the Western half of Oklahoma. Unfortunately, our native grasses have been hit hard with this drought. Extreme temperatures paired with no rainfall for at least 60 days basically stopped all native grass growth. Typically, 70% of native grass growth occurs before July 1st. In Oklahoma, July brought the heat dome that basically put a full stop on forage growth for the remainder of the summer. This is verified with the Rangeland Analysis Platform Tool that shows well under average forage growth through October in Ellis (77%), Major (79%), Garfield (78%), Woods (85%), Beaver (83%), Blaine (78%), and Kingfisher (74%) counties. This is not all the counties in our area, but it provides an understanding of lower-than-average standing forage available for producers. No wonder many people started feeding before September 1st!
So, what is there to do? I think addressing the factors of feeding and supplementation this fall, winter, and early spring is a positive first step (maybe essential!). Fall Feeder Calibration Clinics are an excellent first move to making sure you are delivering the right amount of feed. There are clinics being offered across NW OK so take time to check one out but also know you can do this at home! Contact your local county OSU Extension Educator for help with this or come see us at one of the local clinics at a coop near you!
- 10/20 at Dacoma Coop in Waynoka, OK 10AM-1PM
- 10/21 at Dacoma Coop in Freedom, OK 9AM-12PM
- 10/22 at Sooner Plains Coop in Fairview, OK 11AM-1PM
- 10/23 at Farmers Grain in Nash, OK 9AM-11AM
- 11/3 at Farmers Grain in Nardin, OK 9AM-11AM
- 11/6 at Farmers Coop in Perry, OK 9AM-11AM
- 11/11 at Woodward County Fairgrounds after 12PM Fall Beef Meeting
Keeping Machinery vs Buying New Machinery
Alberto Amador, West Area Ag Economics Specialist
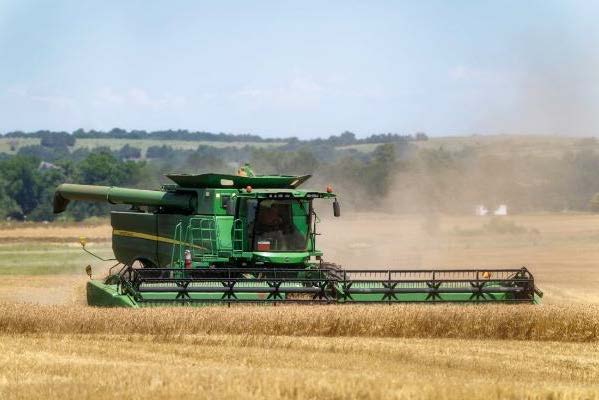
Farm machinery market conditions have changed in the last decade. Supply and demand have faced different shocks that have affected prices. Due to COVID-19, manufacturers’ supply chains faced bottlenecks. Consequently, production pace and inventory levels decreased. Meanwhile, high crop prices caused producers to increase production and seek new machinery. After 2022, interest rates and machinery production costs increased. Currently, tight crop margins and interest rates influence farmers’ purchasing decisions. Farm machinery demand shifted, with demand for keeping old machinery and used machinery increasing, whereas demand for new machinery has decreased.
 According to the Association of Equipment Manufacturers (AEM), overall farm machinery sales have declined year-over-year. The percentage changes compared to last year are -12.3%, -24.4%, and -9.1% for total 2WD farm tractors, 4WD farm tractors, and self-propelled combines, respectively. Regarding used machinery, inventory levels for tractors with 100 horsepower and greater were down 15.5% year-over-year, while auction values (price paid at the wholesale market) increased 4.5% year-over-year. Combine inventory levels have fallen 10%, and auction values increased 4.6% compared to last year. In simple terms, low inventory levels of used farm machinery show tight supply, whereas high auction values reflect strong demand.
 The average farm loan rates reported by the Federal Reserve Bank of Kansas City in the last 5 years hit their lowest level, under 5%, during Q2 and Q3 of 2021, before peaking around 8.5% in 2023. During the first two quarters of 2026 rates averaged 7.5%. Additionally, the Federal Reserve increased the federal funds target rate by 25 basis points to 4% on September 16. The federal funds target rate serves as the baseline for commercial banks when setting their lending rates.
Therefore, under the context that high input costs narrow crop margins, I’d argue that used farm machinery demand will remain at high levels or go up slightly, while new farm machinery would move toward a downward trend. Under these conditions, producers face a machinery decision: keeping existing machinery, buying used machinery, or buying new machinery. However, it’s an important decision that may impact the operation for multiple years, your operation characteristics can help show the better decision.
To analyze machinery costs, we should break down machinery expenses. There are operating costs, which include fuel, oil, repair, and maintenance, and ownership costs which include depreciation, interest, taxes, and insurance. Basically, they are the expenses related to the purchase of the machine. Although depreciation is an accounting cost because it is non-cash, it should be considered.
Diesel prices and labor time are external factors that have a large influence on operating costs. However, both impact new and old machinery. For this reason, repairs and maintenance are the main costs of old machinery. Theoretically, repair costs should be lower on a new machine, although it carries higher ownership costs. According to the American Society of Agricultural and Biological Engineers (ASABE), repair costs are not linear, the costs rise quickly after passing a key operational milestone (hours). On the other hand, the most significant ownership costs are interest and depreciation. When interest rates are high, the capital recovery costs (depreciation + interest) go up for new and late models.
Therefore, a good economic indicator for making farm machinery decisions, holding old machines or buying a new one, is the difference between repairs costs and capital recovery costs. If repair costs are lower than depreciation and interest costs of a new machine, it is feasible to keep an old machine as long as its size and performance fit the farm’s objectives. This premise assumes that old machines would have low timeliness costs (time the machine is out of the field on crucial dates) because of maintenance. Even though new machinery sales have decreased, and used machinery demand have increased, and interest rates remain high, there could be a potential increase in spare part prices and repair costs due to old machinery remaining in the field. Therefore, consider applying this analysis in your decision process.
Rabies Alert
Barry Whitworth, DVM
Senior Extension Specialist/BQA State Coordinator, Department of Animal & Food Sciences, Freguson College of Agriculture
 On September 10, 2026, the Centers for Disease Control and Prevention (CDC) issued a Health Alert Network Advisory in response to multiple reports of human exposure to rabid or possible rabid animals. According to the advisory, CDC reported a 17% increase in questions related to rabies exposure from July through August compared to the same period in 2025.
 State health departments have reported several cases of rabies exposure this year. The North Carolina Department of Health and Human Services investigated an incident involving a mobile petting zoo. Ultimately, several baby goats were diagnosed with rabies which resulted in several people being advised to take post-exposure prophylaxis (PEP) treatment. In Maryland, the Frederick County Health Department reported that 2 beavers tested positive for rabies. One of the beavers attacked a man fishing. One of the most recent reports involved a heifer in Minnesota. This incident resulted in the owner, the owner’s daughter, two minor children, two of the veterinarians that examined the animal, and three assisting veterinary technicians being advised to seek PEP or rabies booster vaccinations.
According to the rabies disease map found at the Oklahoma Animal Disease and Diagnostic Laboratory, Oklahoma reported 36 cases of rabies through September 25, 2026. Rabies was diagnosed most often in wild animals with skunks (21) being the most affected species, followed by cattle (6), cats (5), and dogs (2). There was 1 horse and 1 bat.
Prior to 1947, human cases of rabies were as high as fifty cases per year. Domestic animal cases of rabies were in the thousands. However, in 1947 a campaign was started to vaccinate dogs against rabies in the United States. As a result of this massive campaign, human and domestic animal cases of rabies in the US decreased dramatically. Currently, the US deals with less than 10 human cases of rabies per year. However, around 1.4 million Americans still seek medical attention from potential rabies exposure every year and 100,000 receive PEP. Anyone who has questions about exposure to rabies should contact the Oklahoma State Department of Health at (405) 426-8710 and ask to speak with Epi-on-Call. The Epidemiologist is available 24/7 and will assist in determining if an individual needs PEP.
The spread of rabies to domestic animals or people is usually from a bite from an infected animal. The virus may gain entry by saliva coming in contact with a mucous membrane or a break in the skin. Aerosol transmission has been reported in laboratories and bat caves, but this is very rare. Once an animal or person is infected, the virus will enter the central nervous system. The time from exposure to onset of clinical disease is highly variable, with bites in the face being the shortest.
Animals infected with rabies initially display nonspecific clinical signs such as abnormal behavior, anorexia, lethargy, fever, and vomiting. Following the initial nonspecific clinical signs, signs associated with the neurological system will begin to appear such as ataxia, weakness, self-mutilation, paralysis, seizures, aggression, swallowing difficulties, excessive drooling, abnormal vocalization, and straining to defecate or urinate. Many of these signs can be confused with signs of other diseases or health issues. For example, swallowing difficulties may be interpreted to mean the animal is choking. A person may try to examine the mouth and be infected with the virus accidentally. Once clinical signs appear, death usually occurs in the next few days.
When an animal has neurological signs, rabies should be suspected. Producers should avoid contact with the animal and contact their local veterinarian. If the veterinarian suspects rabies, they will not treat the animal since the condition is fatal and the danger to humans is not worth the risk of treatment. To confirm the diagnosis of rabies, a veterinarian will submit the brain for testing.
Rabies can be prevented by vaccination and by preventing unnecessary exposure of domestic animals to wildlife. All pets should be vaccinated. Obviously, vaccinating a large herd or flock of animals would not be cost effective. However, animals that are in constant contact with humans such as show animals, a family milk cow, or horses should be vaccinated. Preventing contact with wildlife is difficult but keeping the farm clean and free of food sources should discourage wildlife from entering areas where animals are kept.
Additional information about rabies is available at the CDC. Also, livestock producers may contact their local veterinarian and/or their local Oklahoma State University Cooperative Extension County Agriculture Educator for more information.
References
Frederick County Health Department, MD.
Minnesota Board of Animal Health
North Carolina Department of Health and Human Services
Pieracci, E. G., Pearson, C. M., Wallace, R. M., Blanton, J. D., Whitehouse, E. R., Ma, X., Stauffer, K., Chipman, R. B., & Olson, V. (2019). Vital Signs: Trends in Human Rabies Deaths and Exposures - United States, 1938-2018. MMWR. Morbidity and mortality weekly report, 68(23), 524–528.