

Ag Insights May 2026
Monday, May 4, 2026
Wheat Disease Update
Meriem Aoun, Small Grains Pathologist
Posted on May 5, 2026, by Amanda De Oliveira Silva
Barley Yellow Dwarf and Wheat Streak Mosaic are Widespread and Severe in Multiple Oklahoma Wheat Production Regions
Barley yellow dwarf (BYD) remains severe in multiple locations in Oklahoma. Symptoms of BYD include stunting and yellow or purple discoloration on leaf tips (Figure 1). The discoloration increases over time, progressing from the leaf tip toward the base until much or all of the leaf is discolored. Barley yellow dwarf virus is transmitted by cereal aphids. When infection occurs in the fall, the virus has more time to disrupt plant growth, and yield losses are usually higher than when infection occurs in the spring. This season, BYD has been observed in Payne, Noble, Grant, Woods, Texas, Garfield, and Grady counties. The high incidence of BYD in 2026 could be attributed to warmer winter conditions, which favored aphid survival and virus transmission. In addition, freeze stress earlier in the spring may have contributed to more pronounced BYD symptom expression.
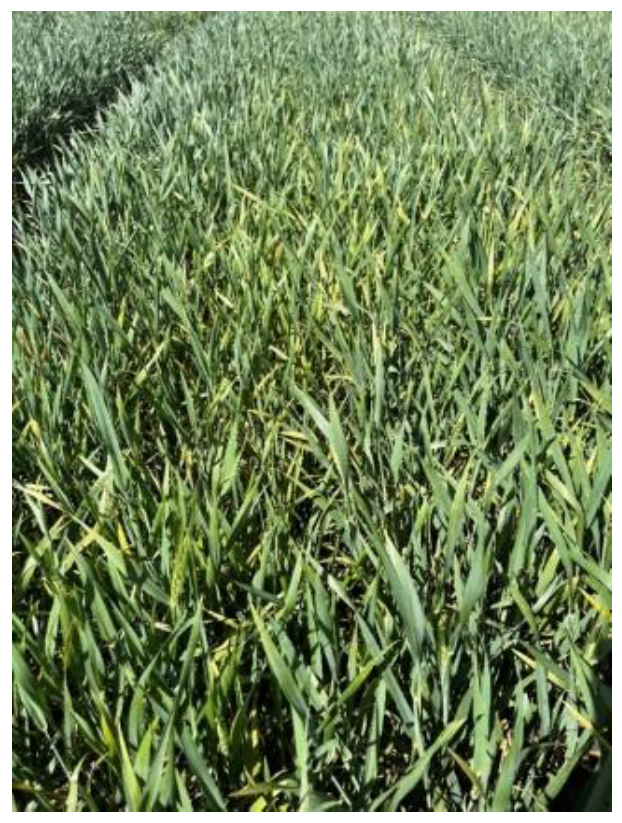 Figure 1. Barley yellow dwarf symptoms in Stillwater, OK (April 7, 2026).
Since early March, wheat streak mosaic (Figure 2) has been observed in Blaine, Garvin, Noble, Kay, Texas, Payne, Beaver, Kingfisher, Garfield, and Grady counties. The WSM virus complex includes wheat streak mosaic virus (WSMV), Triticum mosaic virus (TriMV), and the High Plains wheat mosaic virus (HPWMV), all of which are transmitted by the wheat curl mite. Samples submitted to the OSU Plant Disease and Insect Diagnostic Lab indicated that WSMV was the most commonly detected virus. Compared with previous years, the frequency of TriMV has increased. Triticum mosaic virus was confirmed in samples from Garvin, Texas, Grant, Beaver, and Kingfisher counties. In most cases, TriMV was detected alongside WSMV, although some samples were infected with TriMV alone. High Plains wheat mosaic virus was also detected, but at lower frequency and confirmed in samples from Kingfisher, Kay, Garvin, and Blaine counties.
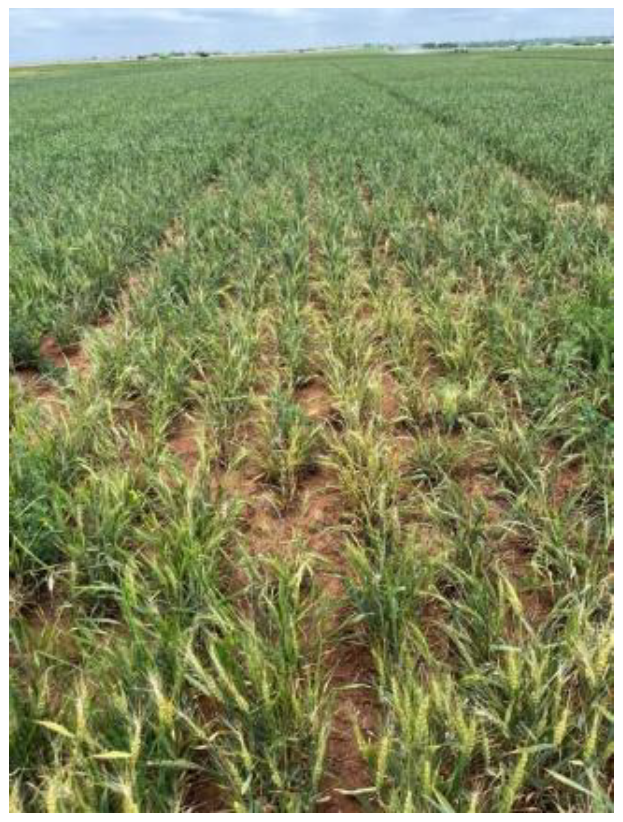 Figure 2. Wheat infected with wheat streak mosaic at Chickasha, OK (April 24, 2026).
Wheat plants exhibiting symptoms of both BYD and WSM (Figure 3) were observed in Garfield, Grady, Payne, Noble, Grant, and Texas counties. Co-infection with multiple viruses can increase symptom severity and yield losses.
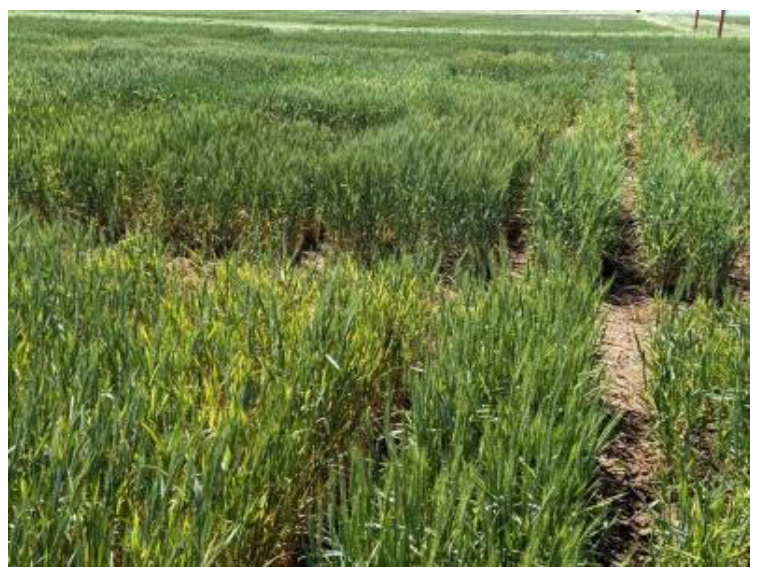 Figure 3. Wheat research plots showing symptoms of barley yellow dwarf and wheat streak mosaic at Lahoma, OK (April 18, 2026; Photo by Dr. Brett Carver).
High Leaf Rust Incidence and Severity
Leaf rust incidence and severity increased rapidly during the last two weeks of April and into early May. Leaf rust has been observed in nearly every field visited across Oklahoma, including drought-stressed fields in southwest Oklahoma. On April 20, low levels of leaf rust were detected in the variety trial at Walters (Cotton County in southwest OK). Higher incidence and severity have been observed in other locations in Central and North Central Oklahoma. On April 24, moderate levels of leaf rust were observed at Chickasha (Grady County). Higher incidence and severity developed during late April and early May at Stillwater (Payne County) and Lahoma (Garfield County), where severity reached up to 100% on susceptible varieties. As leaf rust increased, much of the wheat crop had already passed the flowering stage, limiting opportunities for fungicide application. At this stage, the primary line of defense is the use of resistant varieties. Because infection occurred relatively late in crop development, yield losses associated with leaf rust will be lower than those that could have occurred if infection had occurred earlier.
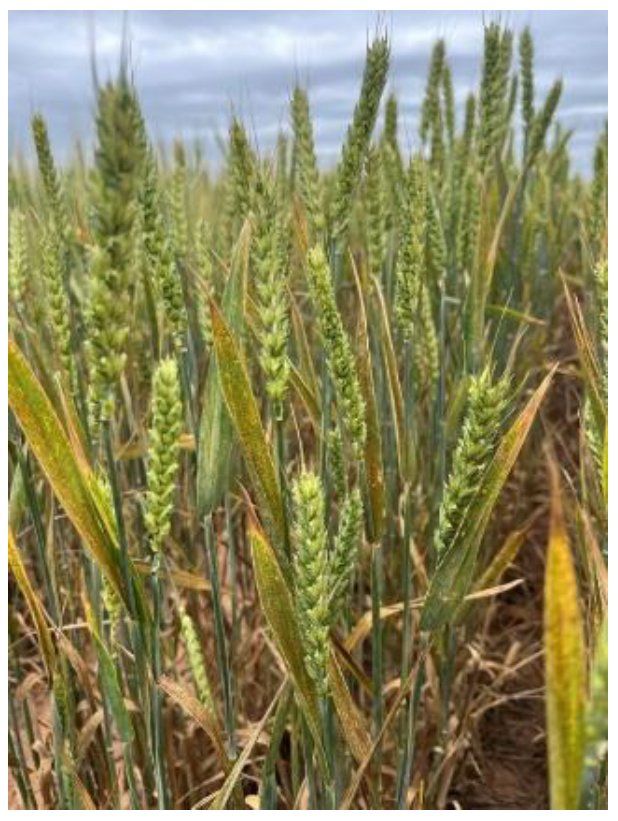 Figure 4. Leaf rust on a susceptible variety at Lahoma, Oklahoma,(April 26, 2026)
Evolving Thoughts on Summer Mineral Intake
Dana Zook, NW OK Area Livestock Specialist
I would say, “Summer’s here!” but as I write this article on May 6th, morning temps were barely 50 degrees. I’m in my flannel shirt this morning but pushing back on the unseasonably cold temperatures to write about a summer topic dealing with mineral intake. Mineral supplementation seems to be an obvious, over-addressed topic however recent research out of Mississippi brings to light surprising results on mineral intake in mature beef cows. It’s a study that every cattle producer should ponder as minerals are offered this summer.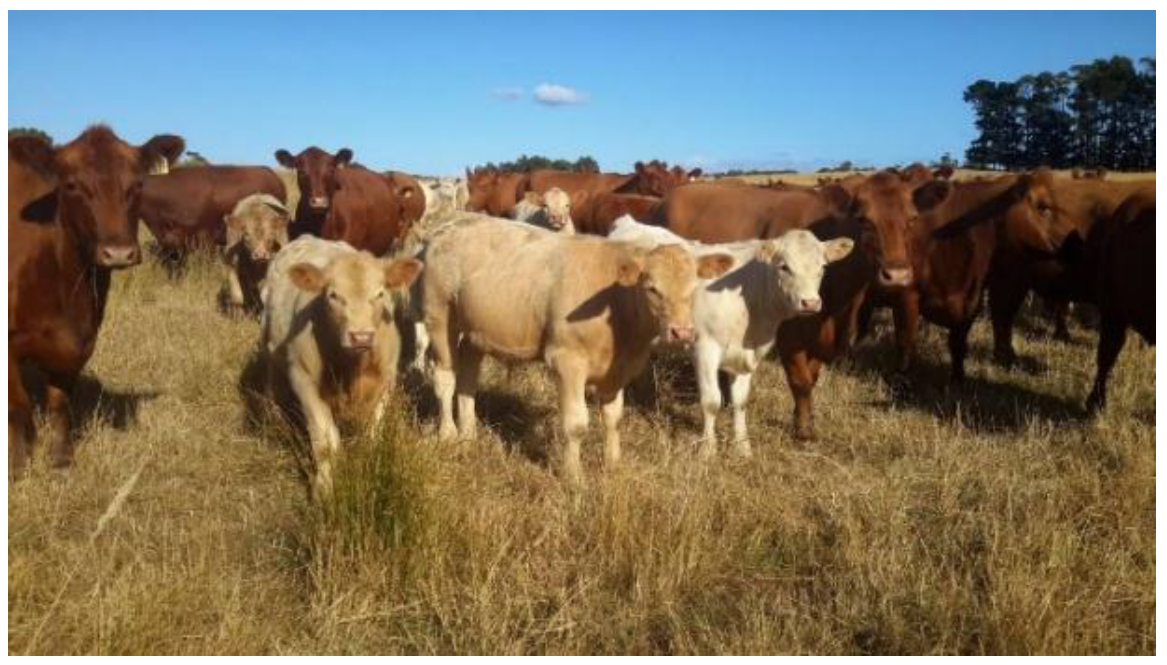 Figure 5. Cows Standing in a field.
To begin with, minerals are most commonly offered to cattle either by hand-feeding a mineral containing ration or providing a mineral supplement free-choice. Incorporating minerals in a diet that is hand-fed provides the most accurate mineral intake. On the other hand, providing minerals free choice is convenient for producers who have cattle on pasture, and may not necessarily be feeding every day. Mineral intakes within these two systems can be starkly different and Mississippi State researchers revealed the challenges that can come with inconsistent intakes.
In this study, Dr. Isaac Jumper and others evaluated consumption of chlortetracycline (CTC)-medicated mineral to gestating Angus-Charolais cross commercial cows on pasture in Mississippi. To give some clarity, it is common to use free-choice mineral supplements as a vehicle to deliver a variety of medications to cattle on pasture (McDowell. 1996, Arthington and Ranches. 2021, and Tait and Fisher. 1996). In this study CTC was the medication utilized within the mineral to minimize the symptoms of Anaplasmosis. Cows ranged in age from 3-17 years but averaged 6 years of age. While on the study, cows grazed a blend on standing forages containing fescue, dallis grass, and common bermuda. These cows were split into three groups and first fed a corn distillers + salt mixture for 27 days to adapt the animals to the Smart Feeder. After this adaptation period, the DDG mixture within the Smart Feeder was instead filled with CTC medicated commercial mineral and fed for 46 days. Radio frequency identification (RFID) tags on each animal were used to track mineral consumption using a Smart Feeder.
The combination of the RFID tags with the Smart Feeder revealed interesting results. During the 27-day adaption period (DDG+Salt), 76.3% of cattle visited the mineral feeder daily. In contrast, during the 46-day mineral feeding portion of the trial, only 27% of cows visited the feeder daily. I wasn’t surprised to read that cattle also consumed more of the DDG blend on each visit than the CTC mineral. In fact, during the 46-day CTC mineral period, the average consumption was only 0.09 pounds which is well below the typically recommended consumption rate of 0.25 pounds (or 4oz.). Because of this poor consumption level, CTC was consumed well below the labeled rate.
Target consumption for minerals was to provide 1.1 mg CTC/kg bodyweight per day, and cattle only consumed the labeled rate of CTC on average 6.4 days out of the 46 days in the trial period. This brings to question the efficacy of this level of CTC and the compliance with the label. The reality is that free choice feeding rarely leads to accurate consumption – think hay consumption and grain feeding in a self-feeder. Mineral is the same way, but convenience is important to an industry with an ever-growing to-do list. Is there a solution here? I’m not sure but I know that KNOWLEDGE IS POWER! I challenge producers to look at your mineral label and track mineral consumption this summer. Extension has a handy mineral rack card that allows producers to easily track each time mineral is fed. Tracking mineral can help you evaluate mineral consumption but also help ensure cattle are accurately consuming those very important additives for Anaplasmosis and Fly control. Reach out to your county educator for help evaluating mineral consumption. We are here to help!
Kay and Grant County Extension Cedar Rodeo Slated for May
Dana Zook, NW OK Area Livestock Specialist
In many areas of Oklahoma, uncontrolled expansion of trees and brush has changed our landscape. At first, change was slow, but some locations are now seeing exponential advancement of tree growth. The Eastern Redcedar is the biggest culprit in Oklahoma and other states, having adapted to a wide array of soil types and weather conditions. Besides the three counties of the OK Panhandle, E. Redcedars have made their mark, swallowing up valuable and productive rangeland across the state.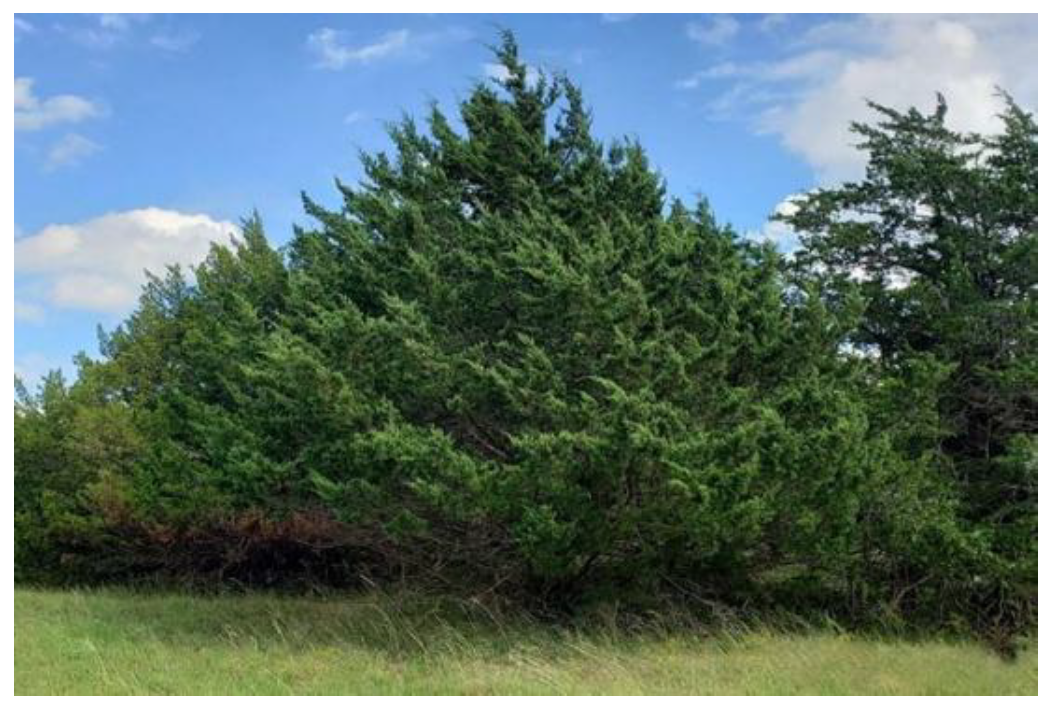 Figure 6. Exponential advancement of tree growth.
Furthermore, resprouting trees such as the American Elm, Chinese Elm, and Honey Locust are spreading due to shelterbelt planting at the turn of the century and continued lack of natural fire. Encroachment of all types of trees and brush impact water stores, for age production and wildlife habitat. Without control, woody encroachment pulls on water stores and shades out forage plants that are used for wildlife and livestock production. Areas dominated by the Eastern Redcedar may see reductions in rangeland carrying capacity (stocking rate). Producers might find this might be hard to initially identify but evidence of reduced carrying capacity could be detected by increased feed costs or earlier need for supplementation compared to the past.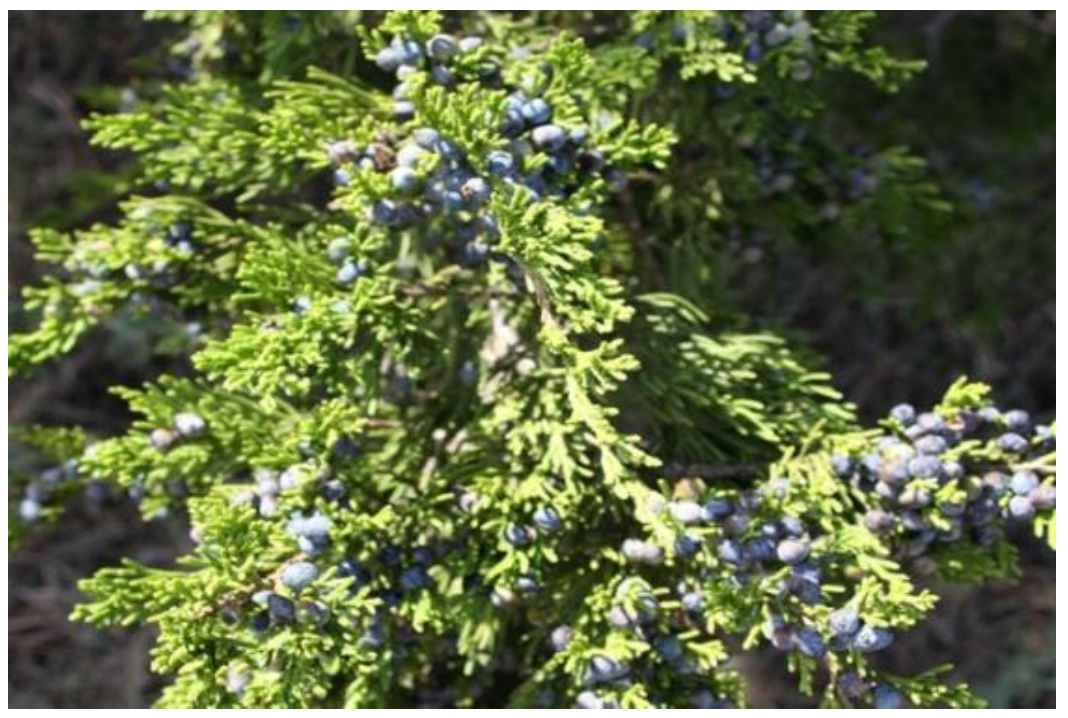 Figure 7. Tiny, blue berries on a tree branch.
Advancements in technology in the past decade have allowed for the development of tools to help quantify the issue of tree encroachment. An online imaging tool powered by Google Earth called the Rangeland Analysis Platform (RAP) gives us insight into the level of woody encroachment in Oklahoma. This tool shows that in 1986 the entire state of Oklahoma had approximately 12% of its land area covered by trees (8,388 sq. miles). Our most recent measurements (2025) show that 27% of the state is now covered by trees (19,000 sq. miles). In just 39 years, Oklahoma has lost 10,598 square miles or 6.7 million acres to woody encroachment.
To target this growing problem, OSU Extension has been increasing programming and education on ways to manage E. Redcedar and other trees. This spring, Kay and Grant County Extension offices are hosting Cedar Rodeos to showcase the management of the E. Redcedar. These interactive educational events will be hosted with a local landowner and will showcase prescribed fire, mechanical control and research on chemical control of E. Redcedar. Local representatives will also be present to highlight cost-share programs for landowners.
Each event is free to the public and will have a sponsored lunch. To get a count for lunch, please RSVP to the respective county Extension office by Monday prior to each event.
The Grant County Cedar Rodeo will be held on Thursday, May 21st from 10AM – 2PM and will begin at 22314 County Road 830 Nash, OK 73761. Register for this event by calling Grant County OSU Extension at 580-395-2134.
The Kay County Cedar Rodeo will be held on Thursday May 28th from 10AM-2PM and will begin at 9627-9559 E. Tower Rd Ponca City, OK 74604. Register for the Kay County Cedar Rodeo by calling Kay County OSU Extension at 580-362-3194. For more information about these programs or to register, please give these offices a call!
The Big Three Operating Costs in Spring Crops
Alberto Amador, West Area Ag Economics Specialist
The spring planting season is just around the corner, and I bet price volatility and market uncertainty have impacted planting plans. This effect is normal and occurs at different levels every year. According to the latest USDA Prospective Plantings report, national corn and wheat acreage will drop for the 2026 crop year and soybean acreage will increase, in comparison to last year. While in Oklahoma, planting intention shows a stronger preference for wheat and oilseeds (soybean and canola) for the coming crop year, and similar to the national trend, the report shows a decline for corn acreage. Usually, external factors such as price forecasts, costs of production, and market conditions influence perception and these planting intentions. The prospective plantings report provides an estimation of how the production and expected supply will look. Some opinions suggest the growth in soybean acreage is because this crop doesn’t require as much fertilizer compared to corn. However, looking at profitability, it doesn’t matter if a farmer decides to grow corn or shift to soybeans, the current challenges are the same. As I have mentioned in previous columns fertilizer, machinery and herbicide costs are increasing and threatening farmers’ margins. I’ve calculated estimated variable production costs for corn (complete season) and soybeans (double-crop) with current local prices for Western Oklahoma.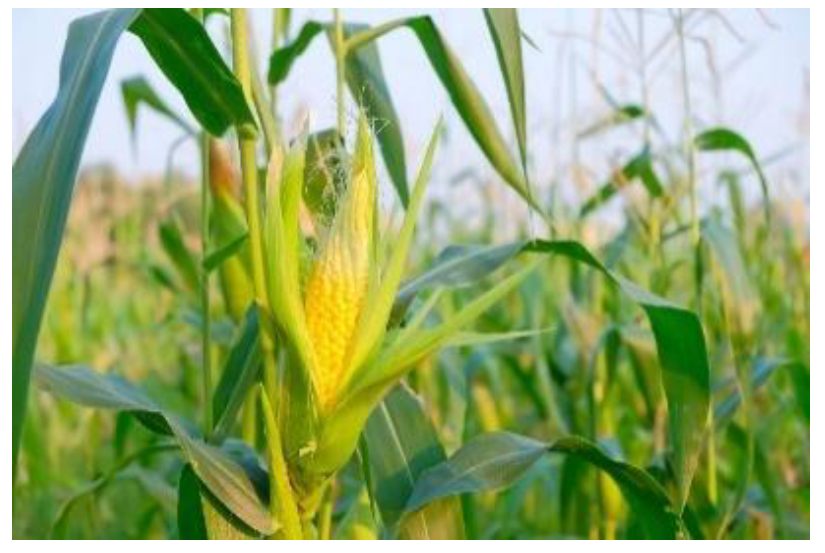 Figure 8. Close-up of an open corn stalk.
Figure 9. Close-up of wheat stalks.
The percentage allocation of variable costs for corn is as follows: Fertilizer 27%, Seed 20%, Herbicides 17%, Machinery costs 13%, Custom Machinery 12% and others 11%. These expenses were calculated assuming the operation owns average sized machinery and using a low-tillage system, using anhydrous ammonia as the nitrogen fertilizer, and custom machinery for fertilizer application and hauling.  Figure 10. Close-up of yellow bud-like flowers.
For soybeans, the input costs weighted differently. The largest percentage is Seed at 26%, followed by Machinery costs at 25%, Herbicides by 22%, Fertilizer by 12% and the rest of the inputs accounting for 14%. A higher percentage for an input doesn’t mean it is more expensive than it is for corn, but rather that each input carries a different weight for the soybean crop. In this case, the calculation was based on a double-crop system using typical machinery. Figure 11. Close-up of soybeans connected to a green stem.
In both cases, these three categories, fertilizer, herbicides, and machinery, account for over 60% of total operating costs. In a context where these “Big Three” dominate the budget, good management is not just about picking the right crop, it’s about managing the inputs that threaten your margin on every acre.
Variable machinery costs are the “controllable” portion of the Big Three. There are areas of opportunity where good management practices could make a difference. Although it requires time to collect farm records to identify these opportunities, it’s the best way to determine best practices or right decisions. For example, if the annual repair cost of a combine is higher than the average, it could be a strong indicator that it’s time to trade it in or check the operator’s driving style.
Regarding fertilizer and herbicides, when prices are high, cutting them is a complex decision because they are directly related to yield. This requires deep analysis because saving on input costs may cause a bigger loss in income. For fertilizers, informed decisions begin with knowing the mineral levels available in soil and comparing the prices of different products offered on the market. However, if prices increase, they will affect profits even when the best decisions have been made. For example, in corn, if the nitrogen source changes to Urea the fertilizer percentage costs go up reaching 37%. This shift reflects how sensitive fertilizer prices are right now. For this reason, a breakeven price matrix is a useful tool to see how many bushels will be needed to cover a shift in fertilizer prices.
While we can’t control the price of inputs, we can control how we respond to them. If you are planning to plant corn or soybeans this spring, your success will depend on managing the “Big Three” and knowing your breakeven points. Use the tables below as a starting point for your own 2026 budget, adjusting them based on your operation’s characteristics.
| Yield | Prices ($4.0) | Prices ($4.5) | Prices ($5.0) |
|---|---|---|---|
| 80 | $43 | $83 | $123 |
| 90 | $73 | $118 | $163 |
| 100 | $106 | $156 | $206 |
| Yield | Prices ($10.43) | Prices ($10.63) | Prices ($10.93) |
|---|---|---|---|
| 18 | $31 | $35 | $40 |
| 25 | $101 | $106 | $114 |
| 30 | $144 | $150 | $159 |
Is Storing Wheat Profitable
Alberto Amador, West Area Ag Economics Specialist
A mandatory question for someone without a wheat contract is: “Should I store or sell my wheat?” Without forward commitment, everyone is looking for the most profitable deal. Because it’s a post-harvest decision, it may seem that the only way to achieve the most profitable income is to sell at the best price, and everybody focuses on the market spread, the difference between prices of a nearby contract (July) and a later contract (December), to decide to store wheat instead of selling it immediately after harvest.
However, chasing the highest price is a mistake. The real goal is achieving the widest profit margin. Because high prices don’t guarantee better profits, there are crucial costs to consider for a sale date decision and determine a true return: 1) storage cost and 2) opportunity cost.
 Figure 12. Golden wheat stalks in a sunlit field.
Regarding storage costs, I would say there are three principal factors that drive the storage fee of grain elevators: interest rate on credit lines they use to finance grain purchases; storage capacity (at higher capacity level the cost of receiving and maintaining grain increases and vice versa); and physical costs such as labor, insurance and energy required to keep the grain in optimal condition. I recommend monitoring these costs for the elevator of your preference.
Opportunity cost is the value of the money overtime. In simple terms, the cost of waiting to receive cash at some point in the future instead of receiving it on the harvest day. The opportunity cost depends on three variables: how many months the grain will be stored, interest rate, and cash price at the harvest moment. The interest rate is determined by where the money comes from. It could come from your own savings or a loan, but both carry an interest rate. According to the last Agricultural Finance Updates by Federal Reserve Bank of Kansas City, for the first quarter of 2026 the rate was 7.2%. For example, on $6/bu. wheat at a 7.2% interest rate, the opportunity cost is 3.6 cents per bushel monthly in opportunity costs.
Opportunity Cost = Cash Price at Harvest × Interest Rate × (Months Stored ÷ 12)
Until now, I’ve only covered the “cost” part of the storage equation. The other half are prices. Despite speculating on prices being a difficult task, it’s a common activity that everyone does, especially when deciding when to sell. Due to wheat harvest representing farmers’ income, this decision will be based on a comparison between real income (present) and possible income (future). These possible incomes should have a high probability and must be higher than the extra storage costs we’ve discussed.
In order to analyze the potential net profit, it is necessary to estimate prices at two different moments: on the harvest day and a target sale day. A simple way to do this is to estimate the cash price, which is the sum of the future price (for the nearby month) and the local basis. The basis is multifactorial and tied to the future prices and storage capacity, following the basic laws of supply and demand. Using historical records is a simple option only as a reference, but it’s important to emphasize that averages don’t reflect current market shocks and unique conditions.
Currently, the market is facing significant uncertainty. While the conflict in the Middle East hast created volatility since March, these geopolitical issues haven’t impacted wheat trade. Currency levels are favorable to exports and the pace of trade is good. At this stage, the USDA’s export estimation is feasible. In contrast, weather has impacted harder. Drought conditions stayed above normal levels and crop condition indexes in the major wheat producer states are lower than the indexes have been in the last two years. These conditions affect production, and consequently basis will be affected as well.
I highly recommend staying tuned to how wheat reacts to the latest rains and how the markets, especially the Kansas Hard Red Winter future prices move in the coming months through all the global changes. With low production, local basis will tend to increase but remember to look closely at the basis on your target sale date and not only the future price. To put this all together, use the following formula to see if the market is actually paying you to wait.
NetReturn = (Price Future - Price Harvest) - (Cost Storage + Cost Opportunity)
Salmonella in Backyard Poultry
Barry Whitworth, DVM
Senior Extension Specialist/BQA State Coordinator, Department of Animal & Food Sciences, Ferguson College of Agriculture
This is the time of year when many backyard poultry enthusiasts are excited to welcome new chicks to their flocks. Some producers hatch their own chicks, while others purchase chicks from local farm and garden centers during their annual “chick days.” Some producers’ chicks arrive by mail from hatcheries across the United States. This is always a very exciting time. Unfortunately, another problem seems to coincide with the arrival of new chickens: Salmonella outbreaks in humans.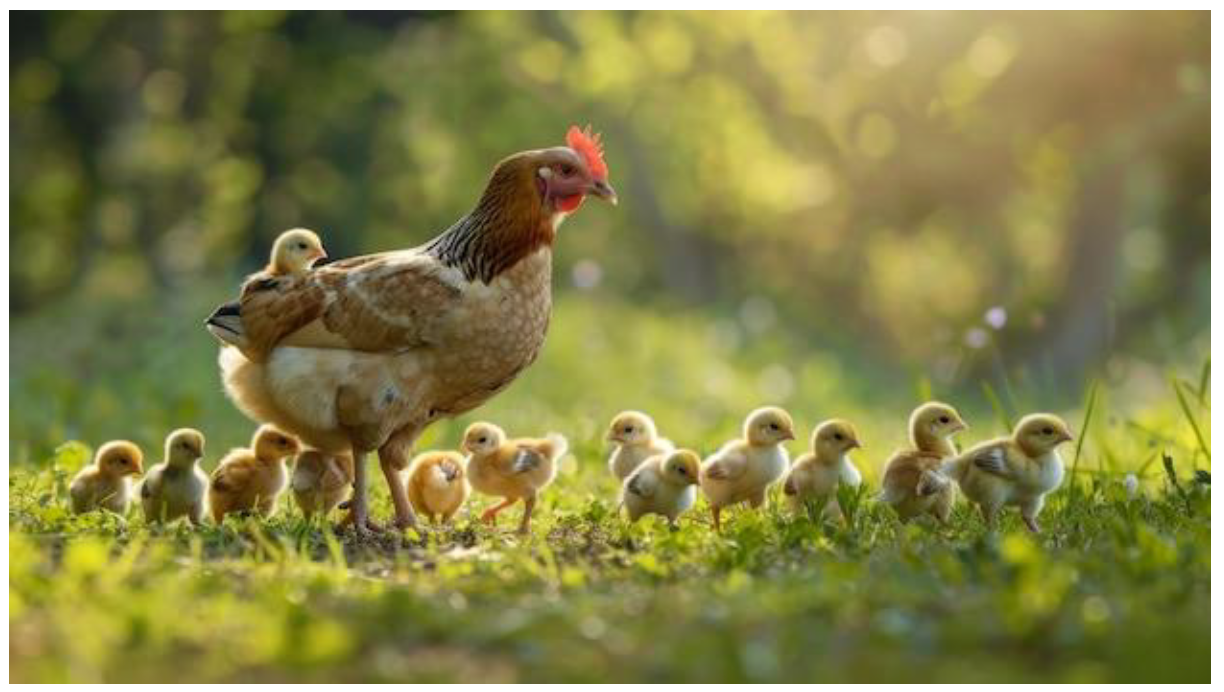
Figure 13. A hen standing in sunlit grass surrounded by fluffy chicks with one chick on her back.
On April 23, 2026, the Center for Disease Control and Prevention (CDC) announced the multistate investigation of Salmonella infections linked to backyard poultry. At the time of the writing of this article, 34 individuals have been diagnosed with Salmonella Saintpaul in 13 states. It should be kept in mind that the CDC believes that for every 1 Salmonella case reported, 29 cases go unreported. Of the 34 reported cases, 13 of the individuals have required hospitalization. No deaths have been reported. The age of those infected ranges between less than 1 to 79 years of age. Currently, Oklahoma has not reported a case.
Chickens, ducks, and other poultry can carry the Salmonella organism. The bacteria do not normally make birds sick, but when people accidentally ingest the organism, severe illness may occur. The bacteria are found in poultry droppings and can also be present on the birds’ bodies. Salmonella can contaminate cages, coops, feed and water dishes, and the areas where birds roam. People may become infected when handling poultry, entering poultry areas, handling equipment associated with poultry, or gathering eggs.
Salmonella infections in humans affect the digestive tract. Typical clinical signs include diarrhea, vomiting, fever, and abdominal cramps. If the infection goes from the intestinal tract to the bloodstream, the disease usually becomes more severe. Most people with severe infections will require hospitalization.
According to the CDC, children tend to be overrepresented in Salmonella infections associated with backyard poultry. From 1990 to 2014, Salmonella infections linked to backyard poultry in children less than 5 years of age accounted for 31% of cases and 42% of cases occurred in children less than 10 years of age. During the current outbreak, 41% percent of those infected are less than 5 years old.
Although there are many sources of Salmonella contamination, animal-contact Salmonella infections result in more young people being hospitalized than food borne infections. This indicates that children need to be carefully monitored when around poultry. Other groups that should be cautious around poultry include people over the age of 65, pregnant women, and people with a compromised immune system.
There are two main reasons children may be at higher risk for developing Salmonella infections from backyard poultry. One reason is that children’s immune systems are not fully developed. The other is children typically have poor hand hygiene practices. One practice that might expose young children to Salmonella organisms is keeping chickens inside the home. During the 2015 outbreak associated with backyard poultry, the CDC reported that 41% of those questioned indicated that they kept baby poultry indoors. Basler’s analysis reported that 61% (227/373) of all people reported getting Salmonella from backyard poultry had touched baby birds. Additionally, 49% (196/400) reported snuggling baby birds while 13% (53/400) admitted to kissing baby birds. Children should be discouraged from engaging in these practices.
Parents and leaders overseeing 4H or FFA poultry projects must ensure that children and young people wash their hands after contact with poultry. The following are some suggestions to reduce the risk of Salmonella infections:
- Wash hands with soap and water after having any contact with poultry or any area where poultry are located. If soap is unavailable, use a hand sanitizer.
- Do not allow poultry to enter areas where food and drinks are prepared, served, and stored.
- Do not eat or drink where poultry are located.
- Cook eggs thoroughly.
- Clean poultry-related equipment outdoors.
Having chickens in the backyard or exhibiting poultry at the county fair can be very rewarding experiences. However, poultry owners should be aware of the potential for Salmonella infection and always practice good hygiene. For more information on backyard poultry, contact your local Oklahoma State University Extension Educator, or, visit the CDC Salmonella.
References
Basler, C., Nguyen, T. A., Anderson, T. C., Hancock, T., & Behravesh, C. B. (2016). Outbreaks of human Salmonella infections associated with live poultry, United States, 1990–2014. Emerging infectious diseases, 22(10), 1705.
Centers for Disease Control and Prevention. (2015). Four Multistate Outbreaks of Salmonella Infections Linked to Contact with Live Poultry in Backyard Flocks. Atlanta, GA: Us Department of Health and Human Services. Retrieved from: https://www.cdc.gov/Salmonella/live-poultry-07-15/index.html
Centers for Disease Control and Prevention. (2019). 2019: Outbreaks of Salmonella Infections linked to Backyard Poultry. Atlanta, GA: US Department of Health and Human Services. Retrieved from: https://www.cdc.gov/Salmonella/backyardpoultry-05-19/
Scallan, E., Hoekstra, R. M., Angulo, F. J., Tauxe, R. V., Widdowson, M. A., Roy, S. L., ... & Griffin, P. M. (2011). Foodborne illness acquired in the United States—major pathogens. Emerging infectious diseases, 17(1), 7.