Cow-Calf Corner | March 25, 2024
Slow-Moving Feedlot Dynamics
Derrell S. Peel, Oklahoma State University Extension Livestock Marketing Specialist
The March Cattle on Feed report showed February placements at 109.6 percent of one year ago. Placements were anticipated to be higher year over year, but the total was slightly above average pre-report expectations. February feedlot marketings were 103.4 percent of last year, close to expectations. February had an extra day due to leap year, which accounts for some of the February increases. Some of the increased February placements was also due to weather disruptions in January that delayed cattle movements. In fact, combined January and February placements were up just 0.6 percent year over year.
The March 1 feedlot inventory was 11.838 million head, up 1.3 percent compared to 2023. Feedlot inventories have been stubbornly slow to adjust down compared to cattle inventories generally. Table 1 shows that the U.S. calf crop since 2018, the largest calf crop in the last decade, has decreased by 7.5 percent to 2023. This is a total reduction in calf production of 2.72 million head in that six-year period. The 2024 calf crop is expected to be lower still with a smaller beef cow herd coming into this year. The calculated feeder supply on January 1, 2024 was the lowest in data available back to 1972.
| Year | Calf Crop | % Change | Cattle on Feed U.S., January 1 |
% Change |
|---|---|---|---|---|
| 1000 Head | 1000 Head | |||
| 2017 | 35758.2 | 13108.4 | ||
| 2018 | 36312.7 | +1.6 | 14146 | |
| 2019 | 35591.6 | -2.0 | 14367.9 | +1.6 |
| 2020 | 35495.5 | -0.3 | 14657.7 | +2.0 |
| 2021 | 35165.9 | -0.9 | 14667.4 | +0.1 |
| 2022 | 34439.5 | -2.1 | 14694.6 | +0.2 |
| 2023 | 33593.0 | -2.5 | 14195.8 | -3.4 |
| 2024 | 14423.3 | +1.6 | ||
| 6 Year Change | -2719.7 | -7.5 | 55.4 | +0.3 |
Table 1. Calf Crop and Cattle on Feed Dynamics
However, feedlot inventories have remained relatively large despite declining cattle numbers. Table 1 shows that the total U.S. cattle on feed inventory on January 1, 2024 was actually higher than the total cattle on feed on January 1, 2019, following the peak calf crop. Feed inventories continued to climb until 2022. The January 1, 2024 feedlot inventory was down just 1.8 percent from the 2022 peak.
The monthly cattle on feed reports tell the same story. Average monthly feedlot inventories continued to climb until the September 2022 peak of 11.836 million head (Figure 1). The 12-month moving average of monthly feedlot inventories declined from October 2022 – October 2023 before increasing to the current level of 11.62 million head in March 2024, down 1.8 percent from the peak. Recent increases in feedlot inventories are due to short-run changes in timing of cattle, i.e. pulling cattle ahead, but are not sustainable given the smaller overall cattle supplies.
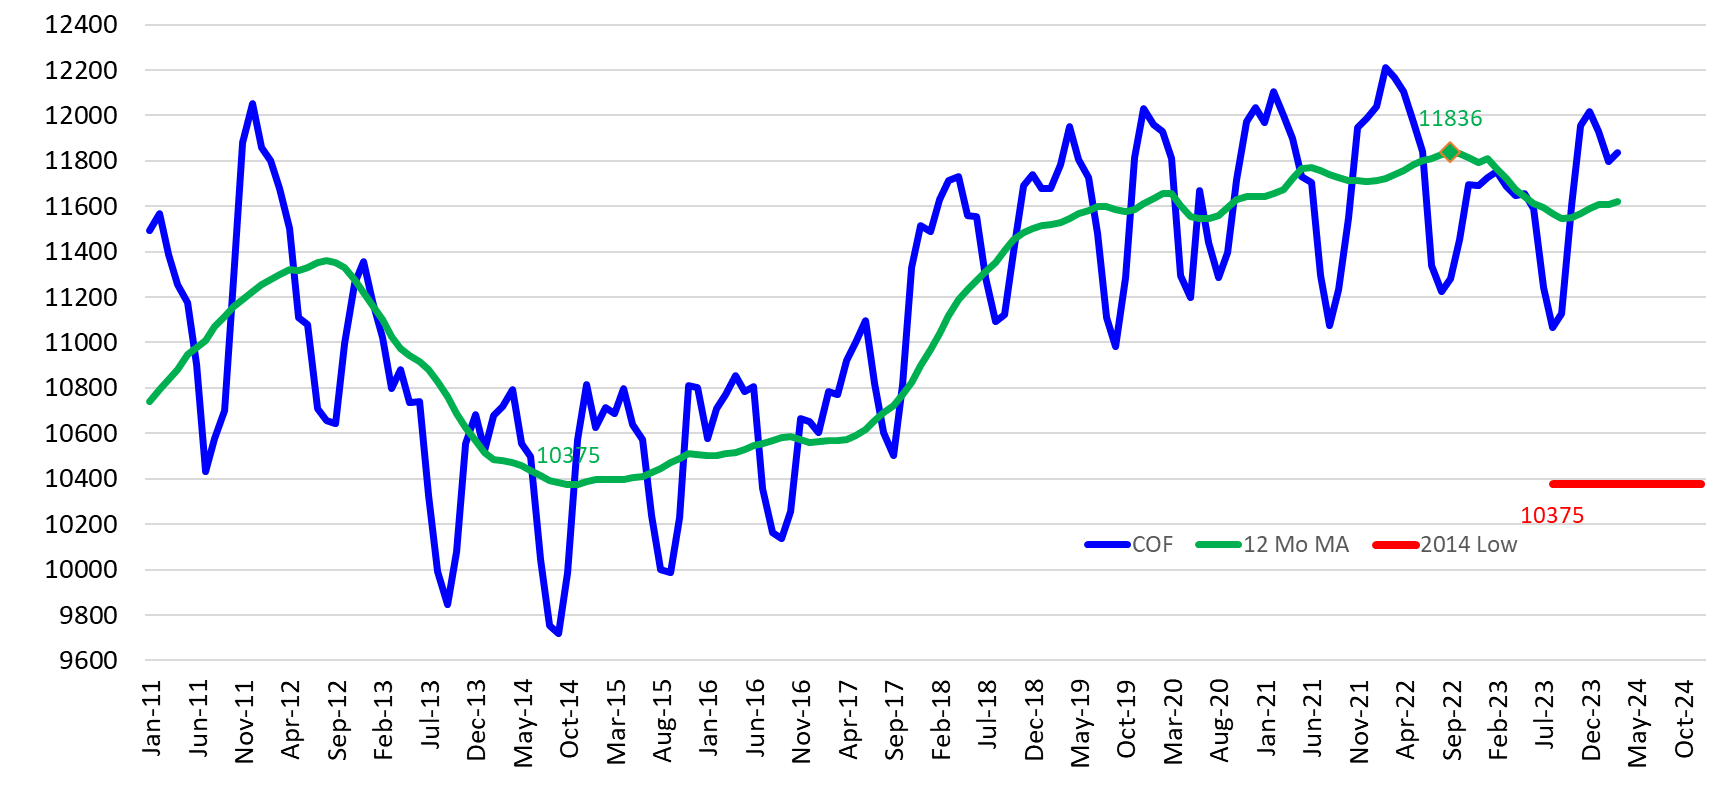
Figure 1. Cattle on Feed. Monthly Total and 12 Month Moving Average, 1000 Head
Figure 1 shows that average monthly feedlot inventories decreased to a low of 10.375 million head in 2014 as head rebuilding began. One of the primary reasons that feedlot inventories have remained as high thus far is due to the continued placement and feeding of heifers. At some point, increased heifer retention will lead to more pronounced decreases in feedlot inventories, perhaps to levels similar to the 2014 low. It's not clear when that will happen as herd rebuilding appears to be progressing slowly and drought continues to be a threat to the size of the beef cow herd. Other factors have contributed somewhat to maintaining feedlot inventories, especially additional days on feed and heavier finishing weights. The year over year increase in Mexican cattle imports in 2023 may be contributing somewhat to the current increase in feedlot inventories but do not explain the generally larger feedlot inventories in recent years. Total feeder cattle imports from Mexico and Canada have been down over the period.
On January 1, 2024, the total feedlot inventory represented a record of 16.5 percent of the All Cattle and Calves inventory in the country. However, decreased cattle numbers and herd rebuilding will inevitably lead to smaller feedlot inventories in the coming months.
Across Breed EPD Adjustment Factors
Mark Z. Johnson, Oklahoma State University Extension Beef Cattle Breeding Specialist
National Cattle Evaluation (NCE), and the resulting Expected Progeny differences (EPDs), have resulted in substantial genetic change since their inception. Typically EPDs are only comparable within breed; however, since 1993 the U.S. Meat Animal Research Center (USMARC) has produced a table of additive adjustment factors which can be used to compare the genetic values of individual animals across breeds. These adjustment factors are available for each of the 18 breeds included in the USMARC database. When producers find themselves in a bull selection situation including multiple breeds, the EPDs can be compared by adding/subtracting the appropriate adjustment factors to the EPDs resulting from the most recent genetic evaluations for each of the 18 breeds. Traits for which factors are estimated include birth weight, weaning weight, yearling weight, milk, marbling score, ribeye area, fat thickness and carcass weight. These factors adjust the EPDs to an Angus basis.
The table below shows the current adjustment factors needed to compare four EPDs across breeds.
| Breed | Birth Wt. (lb) |
Weaning Wt. (lb) |
Yearling Wt. (lb) |
Maternal Milk (lb) |
|---|---|---|---|---|
| Angus | 0.0 | 0.0 | 0.0 | 0.0 |
| Hereford | 0.8 | -14.4 | -39.3 | -10.6 |
| Red Angus | 2.2 | -17.9 | -24.8 | 1.4 |
| Shorthorn | 3.8 | -24.2 | -38.6 | 0.5 |
| South Devon | 3.5 | -37.5 | -63.4 | 10.6 |
| Beefmaster | 3.4 | 26.8 | 7.4 | 6.1 |
| Brahman | 9.0 | 57.6 | 15.5 | 14.9 |
| Brangus | 2.7 | 20.9 | 11.6 | 17.8 |
| Santa Gertrudis | 4.8 | 40.4 | 37.2 | 20.4 |
| Braunvieh | 3.4 | -23.1 | -48.0 | 25.6 |
| Charolais | 6.4 | 6.4 | -22.7 | -1.4 |
| Chiangus | 2.3 | -22.5 | -41.3 | 6.4 |
| Gelbvieh | 3.3 | -10.0 | -20.0 | 7.1 |
| Limousin | 1.8 | -9.3 | -32.1 | -2.7 |
| Maine-Anjou | 1.9 | -27.3 | -55.5 | -7.0 |
| Salers | 2.0 | -17.6 | -30.0 | 10.8 |
| Simmental | 1.8 | -13.3 | -24.3 | -0.6 |
| Tarentaise | 2.4 | 28.0 | -5.6 | 13.3 |
Table 2. Adjustment Factors to Add to EPDs of Eighteen Different Breeds to Estimate Across Breed EPDs
As an example, we will look and Birth and Yearling Weight EPDs of three bulls from three different breeds selling in the OSU Cowboy Classic sale on April 7th, 2024.
Lot 29 is an Angus bull:
Birth Weight EPD = 2.2
Yearling Weight EPD = 144
We are also considering the lot 58 Hereford Bull:
Birth Weight EPD = 2.6
Yearling Weight EPD = 123
And the lot 71 Brangus Bull:
Birth Weight = -0.9
Yearling Weight = 56
No adjustment is needed for the EPDs of the Angus bull. Note the Birth Weight EPD adjustment factor for Hereford is 0.8 and for Brangus is 2.7. The yearling Weight EPD adjustment factor for Hereford is -39.3 and for Brangus is 11.6. Therefore below we show the EPDs adjusted to an Angus basis:
Lot 58 Hereford Bull:
Birth Weight EPD = 2.6 + .8 = 3.4
Yearling Weight EPD = 123 – 39.3 = 83.7
And the lot 71 Brangus Bull:
Birth Weight = -0.9 + 2.7 = 1.8
Yearling Weight = 56 + 11.6 = 67.6
Using the values from the table helps when bull selection decisions involve several breeds. In this example, assuming Yearling Weight is the trait of primary interest, we would expect the lot 29 Angus bull to sire yearlings weighing approximately 60 pounds heavier than the lot 58 Hereford (144 – 83.7 = 60.3). The lot 58 Hereford bull should sire yearlings weighing approximately 16 pounds heavier than the lot 71 Brangus bull (83.7 – 67.6 = 16.1).
The adjustment factors are based on comparisons of progeny of sires from each of the breeds in the Germplasm Evaluation Program at USMARC in Clay Center, Nebraska. These factors are released near the beginning of each year to facilitate the use of these tools during the spring bull buying season.
Reference:
Oklahoma State University Purebred Beef Cattle Center 2024 Cowboy Classic Sale Book
Is Your Dewormer Working?
Rosslyn Biggs, DVM, OSU College of Veterinary Medicine, State Extension Beef Cattle Specialist
Anthelmintic (dewormer) resistance is a growing concern, and given the expense of dewormers, producers and veterinarians need to be sure they are working. Recent Oklahoma State University (OSU) research has shed light on the seeming need to mitigate the challenge of internal parasite resistance in beef cattle.
OSU College of Veterinary Medicine researchers recently published findings that provided evidence of apparent internal parasite resistance in Oklahoma cow-calf herds. In this small study, thirteen of 16 (81%) participating herds had evidence of apparent anthelmintic resistance based on fecal egg count reduction testing (FECRT).
OSU research is ongoing with an expanded opportunity for Oklahoma cattlemen and veterinarians in 2024. Researchers from Veterinary Medicine, Animal and Food Sciences, and Extension are currently conducting a larger study of Oklahoma herds. The study hopes to collect data from at least 50 different groups of cattle from around the state. Samples can be collected from now through fall 2024.
The study is seeking a minimum of 20 (preferably 30) animals that are within the same stage of production. For example, classes of cattle enrolled in the study could be mature cows of approximately the same age, weaned calves, purchased growing and weaned steers or stocker heifers, or replacement heifers. Preference to participate will be given to operations with young animals between the ages of weaning and yearling. More information is needed on these age groups of cattle.
Good animal handling facilities are required where cattle can be safely restrained for fecal collection. The first collection must occur at initial processing/deworming or within seven days prior to that initial processing/deworming. The second collection must occur 10-17 days post-deworming.
Sampling supplies will be provided at no cost. OSU research personnel will coordinate with the participant and extension personnel will make every effort to be present at sampling. Samples must be shipped to the laboratory as soon as possible and a summary of the results along with veterinary interpretation will be provided. There is no cost to the producer for laboratory testing or interpretation.
If you are interested in participating in this project, please fill out the interest form. Once received, the research team will be in contact to coordinate delivery of the sampling kits and other details. Questions on the project may be directed to rosslyn.biggs@okstate.edu or david.lalman@okstate.edu.
New Rancher’s Thursday Webinar Series Focuses on Management of Beef on Dairy Crossbreds in Beef Production from Conception to Consumption
Paul Beck, Oklahoma State University Extension Beef Cattle Nutrition Specialist
A new Rancher’s Thursday Lunchtime Webinar Series will run every Thursday at noon from April 4th to May 2nd. This Webinar will cover the management of Dairy Beef crossbreds in the beef production system. There will be presentations on research dealing with the effects of sire selection and early life management on finishing performance as well as management and performance of dairy-beef crosses in commercial feeding operations. Experts from across the nation will cover recent research and real-world experiences in managing and marketing these unique animal resources.
Register for this online webinar series: Conception to Consumption: Dairy x Beef Webinar Series