Stocking Rate: The Key to Successful Livestock Production
- Jump To:
- Some Working Definitions
- Calculations
- Differences in Stocking of Introduced and Rangeland Forages
- Stocking Rates on Introduced Forages
- Stocking Rates on Rangeland
- Ecological Sites and Soils
- Forage Production and Standing Crop
- Stocking Rates and Harvest Efficiency
- Forage Utilization
- Stocking Rate Effects on Livestock
- Summary
There are many important ingredients in a successful livestock production system. One of the most important tasks is to keep detailed records on livestock stocking rate, livestock performance, and forage production. Forage production and stocking rate records are critical in making timely management decisions. No other single management practice affects profitability of livestock more than stocking rate. This publication discusses how to determine the proper stocking rate for your land.
Some Working Definitions
In order to discuss stocking rate and its effect on animal performance, it is necessary to establish some definitions. Stocking rate is defined as the number of animals on a given amount of land over a certain period of time. Stocking rate is generally expressed as animal units per unit of land area. Carrying capacity is the stocking rate that is sustainable over time per unit of land area. A critical factor to evaluate is how well the stocking rate agrees with the carrying capacity of the land. A term that is used to help understand and estimate forage requirements is the animal unit (AU) concept (Table 1).
Table 1. Carrying capacity in terms of the animal unit (AU) concept.
| Concept | Abbreviation | Definition |
|---|---|---|
| Animal Unit | AU | 1,000 lb. cow with calf |
| Animal Unit Day | AUD | 26 lbs. of dry forage |
| Animal Unit Month | AUM | 780 lbs. of dry forage |
| Animal Unit Year | AUY | 9,360 lbs. of dry forage |
Calculations
A livestock producer has 50 head of 1,000-lb cows on 200 acres for 12 months. The stocking rate of this operation would be calculated as follows:
Example 1: Calculation of stocking rate:
Total Land Area ÷ [(#AUs) x (Grazing Season)]
200 acres ÷ [(50AUs) x (12 months)] = 0.33 acres per AU
month (AUM) or 4 acres per AU year (AUY)
Because cattle and other grazing animals are not the same size, it is often necessary to convert to animal unit equivalents. The term animal unit equivalent (AUE) is useful for estimating the potential forage demand for different kinds of animals or for cattle that weigh more or less than 1,000 lbs. Animal unit equivalent is based upon a percentage (plus or minus) of the standard AU and takes into account physiological differences.
Once again, assuming a forage dry matter demand of 26 lbs. per day, the 1,000 lb. cow is used as the base animal unit to which other livestock are compared. The AUE for cattle of 900 lbs. or less, is calculated as:
AUE = (BODY WEIGHT + 100) ÷ 1,000
or, for animals of 1,100 lbs. or more,
AUE = (BODY WEIGHT-100) ÷ 1,000
Table 2 illustrates several different kinds and classes of animals, their various AUEs, and estimated daily forage demand.
Another calculation can be used to demonstrate the usefulness of the information contained in Table 2. Suppose a producer has 100 head of stocker calves that weigh approximately 500 lbs., the size of the pasture is 100 acres, and the grazing season is 6 months long. The stocking rate would be calculated as before with the exception that the total number of AUs must first be calculated using the AUE information from Table 2.
Table 2. Animal unit equivalent (AUE) and estimated daily forage dry matter (DM) demand for various kinds and classes of animals.
| Animal Type | AUE | DM demand (lbs. per day) | |
|---|---|---|---|
| Cattle | |||
| Calves | |||
| 300 lbs. | 0.4 | 9 | |
| 400 lbs. | 0.5 | 12 | |
| 500 lbs. | 0.6 | 15 | |
| 600 lbs. | 0.7 | 18 | |
| Cows | 1.0 | 26 | |
| Bulls | 1.25 | 32 | |
| Horses | 1.25 | 32 | |
| Sheep | 0.2 | 5 | |
| Goats | 0.17 | 4 | |
| White-Tailed Deer | 0.17 | 4 |
Example 2: Calculation of stocking rate using AUEs:
First, estimate the total number of AUs based on AUEs:
(# Head) x (AUE) = Total AUs
100 head x 0.6 = 60 AUs
Then, calculate the stocking rate as before.
Total Land Area ÷ [(# AUs) x (grazing season)] = Stocking Rate
100 ÷ (60 x 6) = 0.27 acres per AUM or 1.7 acres for the season.
Calculating stocking rate is relatively simple once the concept and terminology are understood. The ability to calculate stocking rate and make timely management decisions is vital to maximizing net returns from the livestock operation.
Differences in Stocking of Introduced and Rangeland Forages
Although the concepts of stocking rate determination are similar for introduced and rangeland forages, there is one major difference in estimating stocking rate: allowable use (percent utilization of available forage) is lower for rangeland forage. This can not be emphasized enough; introduced forages can be utilized to a higher degree than rangeland forages if adequate moisture and fertility are available. Working through some examples for both types of systems should help clear up any misunderstanding. Utilization does not equal consumption by the animal for any kind of forage. Utilization includes decomposition, waste, and consumption by insects and other herbivores.
Stocking Rates on Introduced Forages
Introduced forages are generally non-native species that have been selected for rapid growth and grazing tolerance. Introduced forage grasses common to Oklahoma include bermudagrass, tall fescue, Old World bluestem, weeping lovegrass, various cereal grains, and ryegrass. Oklahoma producers also use several introduced legumes, including alfalfa, hairy vetch, and numerous clover species (red, white, arrowleaf, rose, berseem). Most introduced forages will tolerate a heavier degree of grazing pressure than rangeland forages because of their rapid regrowth capabilities. Although many introduced forages are tolerant of close grazing, not all the forage produced can be removed. Some residue must be left for the plant to carry out basic metabolic functions.
Table 3 contains suggested residue levels for some forages commonly used in Oklahoma. This information will help prevent overgrazing of pastures.
Using the information in Tables 2 and 3, producers can quickly estimate the animal forage demand and the stocking rate for their livestock production system. For fine tuning of stocking rates on specific ranches; however, forage production information from long-term record keeping will be necessary because long-term data takes into account fluctuations in precipitation. Moisture is generally the most limiting factor relative to forage production.
Table 3. Suggested residue height of selected introduced forages for optimum animal performance
and stand
persistence.
| Species | Residue Height (inches) | Utilization Maximum (%) |
|---|---|---|
| Alfalfa | 4-6" | 50 |
| Annual Ryegrass | 3-4" | 75 |
| Arrowleaf Clover | 3-4" | 50 |
| Bermudagrass | 1.5-3" | 751 |
| Intermediate wheatgrass | 4-6" | 50 |
| Oat | 4-6" | 75 |
| Old World Bluestem | 3-4" | 65 |
| Pubescent wheatgrass | 4-6" | 50 |
| Red Clover | 4-6" | 50 |
| Rye | 4-6" | 75 |
| Tall Fescue | 4-5" | 70 |
| Tall Wheatgrass | 6-8" | 50 |
| Wheat | 4-6" | 75 |
| White Clover | 2-3" | 75 |
1 Can be higher given adequate precipitation and N.
This concept is best illustrated using another example. Assume a livestock operation that has 100 acres of bermudagrass and long-term production records indicate the pasture is capable of producing 5,000 lbs. of forage DM per acre over the growing season. In this particular example, a producer may wish to know how many head of 500 lb. stocker calves they may expect to stock in the pasture. First, estimate the total amount of available forage DM based on historical records and the percent utilization factor from Table 3.
Example 3: Calculation of available forage for grazing:
(Average DM in lbs. per acre) x (# Acres) x (% Utilization Factor)
5,000 x 100 x 0.65 = 325,000 lbs. of Forage DM
Next, estimate the number of animal units that could be stocked on the pasture given the above forage production potential. In other words, calculate the stocking rate in AUs.
Example 4: Calculation of stocking rate (# head) based on available forage:
(Total Forage DM) ÷ [(# Grazing Days) x (Daily Forage Demand for 1 AU or AUE of the animal in question)] = # of Head
325,000 ÷ [(120 days) x (15 lbs. DM per day)] = Stocking Rate
325,000 ÷ 1800 = 181 Head
In this example, a bermudagrass pasture was assumed to be capable of producing 5,000 lbs. of forage DM per acre and it was estimated that a stocking rate of 181 head of 500-lb. stocker calves could be used for a typical 120-day growing season. To express this production scenario as a stocking rate, you would return to the equation used in Example 2.
Example 5: Calculation of AUs from AUEs:
# Head x AUE = Total AUs
181 Head x 0.6 = 109 AUs
Now simply use the equation developed in Example 1 to calculate the stocking rate.
(Total Land Area) ÷ (# AUs)= Stocking Rate
100 ÷ 109 = 0.92 acres per AU
Stocking Rates on Rangeland
Rangeland is the most abundant type of land in Oklahoma and contributes heavily to the beef cattle and recreational leasing industry. Rangeland is the primary source of wildlife habitat throughout the state. Lands that are dominated by native grasses, forbs, shrubs, or scattered trees are considered rangelands. In order for rangeland to be sustainable for beef cattle production, the number of animals and their forage demand must be balanced with forage production. Forage production varies from year to year because of changes in precipitation (Fig. 1-2). Stocking rate should be based on average long-term end-of-season standing crop values (Fig. 2) for an operation to remain productive and sustainable. The procedure for calculating stocking rates can be used on either forests or rangelands.

Figure 1. Precipitation at the Oklahoma State University Research Rangeland, Stillwater, OK.

Figure 2. End-of-season standing crop on an ungrazed Loamy Prairie rangeland site in Payne County, OK.
Ecological Sites and Soils
An ecological site, previously known as a rangeland site, is an area of land with a combination of soil, climatic, topographic, and natural vegetation features that set it apart significantly from adjacent areas. Ecological sites are expressed in terms of soil depth, topography, slope, plant production, and species composition. Vegetation on a particular site will vary in composition and production from one region of the state to another and from year-to-year because of changes in precipitation.
Forage Production and Standing Crop
Stocking rates are based on the amount of forage that is standing at the end of the growing season in an ungrazed condition. End-of-season standing crop is not total production because much of the production has been lost to decomposition and insects. Actual forage production is often twice as large as the end-of-season standing crop. Forage production information is useful but is very time consuming to obtain. That is why end-of-season standing crop is used for estimating stocking rate.
Standing crop should be measured by clipping within grazing exclosures in key areas. The exclosure should be moved each year during the winter. The more years of standing crop information that can be assembled, the better the stocking rate decisions will be. Otherwise, producers must rely on guesses or information from Standard Soil Surveys, which tend to underestimate standing crop.
Stocking Rates and Harvest Efficiency
The recommended stocking rates for rangelands are based on moderate utilization (economic long-term optimum) of the annual forage standing crop and assume uniform grazing distribution. It is also assumed that 50% of the annual peak standing crop can be removed from the ecological site without negatively affecting the plant community relative to species abundance or for beef cattle production. This is the origin of the “take half and leave half” rule-of-thumb that is often used. This is also the source of difference in stocking rate management between rangeland and introduced forages.
Of the 50% of rangeland forage (grasses or forbs) that is assumed to be removed, the assumption is also made that one-half (25% of the total) is actually consumed by livestock and the other one-half (25% of the total) is trampled, laid on, consumed by insects or other animals, or disappears because of decomposition. These assumptions lead to a harvest efficiency of 25%. Another way to look at this is to assume that 25% of the total forage is actually consumed by the grazing animal. Plant requirements regarding remaining residue and waste by grazing animals set these limits. Harvest efficiency, however, can be increased by using rotational stocking (Table 4). This calculation should be adjusted for the presence of bulls, replacement heifers, or other grazing animals.
Assume 100 head of cows that average approximately 1,000 lbs. with calves on a 1,000-acre rangeland pasture. The goal for this cow herd is continuous stocking for 12 months. The stocking rate would be calculated using information contained in Table 1.
Example 6: Calculation of stocking rate:
For a 1,000 lb. cow, AUE = 1.0 (Table 2)
(100 head) x (1.0 AUE) = 100 AUs
(Total Land Area) ÷ [(# AUs) x (grazing season)]
1,000 acres ÷ [(100 AUs) x (12 months)] = 0.83 acres per AUM or 10 acres per AUY
Table 4. Example of impact of harvest efficiency on stocking rate.
| Continuous | Rotation | |
|---|---|---|
| Rangeland forage standing crop | 6,360 lbs. per acre | 6,360 lbs. per acre |
| Available for use | 50% | 50% |
| Amount available for use | 3,180 lbs. per acre | 3,180 lbs. per acre |
| Use efficiency, % of 6,360 | 25% | 35% |
| Forage supply | 1,590 lbs. per acre | 2,226 lbs. per acre |
| Stocking Rate | 2.04 AUM per acre | 2.85 AUM per acre |
| Stocking Rate | 5.88 acres per AUY | 4.21 acres per AUY |
| Cows per 1,000 acres per year | 170 cows | 238 cows |
Next, use forage standing crop to calculate how many stocker cattle this 1,000 acres of rangeland can carry. From clipping data, it was determined over the past 10 years the average peak forage standing crop was 6,360 lbs. per acre from the monitoring program (Fig. 2).
Using these forage standing crop values, one can estimate how many cows could be stocked on this ranch. Using a 25% harvest efficiency for rangeland forages, the stocking rate is estimated as follows:
Example 7: Calculation of available forage for grazing:
(Average Standing Crop) x (% Utilization Factor) x (Total Acres) = Available Forage
(6,360 lbs.) x (25%) x (1,000 acres) = 1,590,000 lbs. Available Forage
Example 8: Calculation of AUs based on available forage:
Available Forage ÷ [(# Days in Grazing Season) x (Daily Forage Demand)] = # AUs
1,590,000 lbs. ÷ [(365 days) x (26 lbs. per day)] =
168 AUs (cows) for 1 year
1,000 acres ÷ 168 AUs = 6 acres per AUY
A slight twist on the calculation would be to assume livestock smaller than the standard AU. Let us assume calves with an AUE of 0.6 (500-lb. calves) that are to be grazed all year.
1,590,000 lbs. ÷ [(365 days) x (26 lbs. per day)] = 168 AUs
168 AUs ÷ 0.6 AUE = 280
Therefore, 280 calves that weigh 500 pounds could be stocked on this same amount of forage.
Example 9: Calculation of AUs from AUEs:
(# Head) x (AUE) = Total AUs
170 head x 1.0 = 170 AUs or for livestock smaller than 1AU
170 head X 0.6 = 102 AUs
Note: Cows should usually be assigned the AUE of about 1.4 because of the presence of bulls and replacements.
Forage Utilization
Forage utilization of key plant species must be known in order to effectively adjust the stocking rate of rangeland forages. Therefore, you must be able to identify the key plant species of each ecological site. Forage utilization can be monitored throughout the year using a utilization class ranking system of 1 through 5 (Table 5). Utilization is measured by rating the standing crop of native grass inside and outside the grazing enclosure. A utilization score of 3 should be the annual goal. In order to get an accurate picture of forage utilization on rangeland, a systematic grid should be established (Fig. 3).
The grid is observed at several different times during the grazing season and a utilization class ranking (Table 5) is assigned to each area. A grazing utilization pattern can then be developed to assess the harvest efficiency. Producers will often find that the same areas are either under-utilized or over-utilized each year (Fig. 4). If utilization scores are above or below 3, then corrective measure should be taken such as developing new water sources, moving mineral feeders, developing new fencing patterns, and the application of prescribed fire.
Another method of judging grazing utilization is measuring the height of key grazing species throughout the pasture (Table 6). This method requires a measuring device and a systematic grid similar to the previously described method. Utilization heights are different for different ecological sites and different regions of precipitation. In forests or savannas, use the height for tallgrass prairie.
Once a grazing pattern is evident, you must then decide whether improvements such as building cross fences, spraying herbicides, developing new water sources, or changing stocking rates will improve the profitability of the operation. Using the previous examples, producers with good forage production records can determine the proper stocking rate for their land.

Figure 3. Grid points are evenly spaced approximately 260 feet apart. Transects are 240 feet apart (120 feet from fences).

Figure 4. Grid points are evenly spaced approximately 260 feet apart. Transects are 240 feet apart (120 feet from fences). A grazing utilization pattern will help to assess the harvest efficiency.
Table 5. Guidelines for estimating forage utilization on native rangeland.
| Utilization Class | Key Species Degree of Use | Plant Description |
|---|---|---|
| 1 | 0-20% | Little or no use of the key grazing species. Grazing use is not apparent from a distance. With close inspection, a few plants of the key species show evidence of light use. Grazed patches are small or not present, grazed heights 8 to 10 inches. |
| 2 | 21-41% | A few of the key grazing species have short stubble heights, but this is not evident as seen from a distance. Otherwise, key species appear unused. Grazed patches 2 to 3 feet in diameter, grazed from 4 to 8 inches. |
| 3 | 41-60% | Stubble heights of key grazing species are non-uniform because of varying degrees of grazing between individual plants. Some use of less preferred species. Grazed patches greater than 3 feet in diameter, grazed from 2 to 6 inches. Most plants will show some grazing use. |
| 4 | 61-80% | Stubble heights of key grazing species are fairly uniform and quite short. Less preferred species have received some use. No ungrazed patches. Some trampling damage and bare ground. |
| 5 | 81-100% | Stubble heights of key grazing species are uniformly short. Heavy use of less preferred species. Trampling effects from concentrated animal use are evident. |
Table 6. Height of key forage species by plant community type.
Plant Community Type |
|||
|---|---|---|---|
| Level of Use | Tallgrass Prairie | Midgrass Prairie | Shortgrass Prairie |
| Light or None | >10 inches | >6 inches | >4 inches |
| Moderate | 6-10 inches | 4-5 inches | 2-3 inches |
| Heavy | 4-5 inches | 2-3 inches | <2 inches |
| Severe | <4 inches | <2 inches | <1 inch |
Stocking Rate Effects on Livestock
Production Systems
Overstocking of rangeland, or overstocking introduced forages coupled with a poor fertility program, typically leads to a reduction in desirable forage species and an invasion of weeds and undesirable grasses such as broomsedge and threeawn. As the incidence of undesirable species increases at the expense of the more desirable forage species, animal performance declines and the carrying capacity of the grazing management unit is reduced. This situation is characterized as an overgrazed situation because of a change in forage species. The results are decreased profitability both from a livestock production standpoint and the possible need for expensive herbicide applications.
Conversely, understocking results in patch (or spot) grazing. Patch grazing occurs where animals repeatedly graze the same area as soon as regrowth is available. Animals continue to utilize previously grazed areas because the immature regrowth is more palatable and of higher nutritive value. Ungrazed areas in the pasture continue to increase in maturity, decline in nutritive value, and become increasingly less palatable. The decline in forage utilization (harvest efficiency) results in wasted forage and decreased profit potential from the livestock operation. In either case, proper stocking rate and some form of rotational stocking could improve the net profitability of the livestock production system.
Stocking rate has a major impact on animal performance and overall profitability of the livestock production system. Figure 5 indicates that maximum individual animal performance occurs at light stocking rates because there is little competition for the best forage plants in the pasture. As stocking rate is increased, the level of animal performance is reduced due to increased competition. The opportunity for diet selection afforded by low stocking rates ensures that individual animal performance is maximized. Figure 5 also indicates that as stocking rate increases, the amount of weight gain produced per acre is increased up to a threshold and then declines.
A famous football coach once commented that three possibilities exist when you throw a forward pass, and two of the three were bad. The same situation exists for stocking rate; three possibilities exist (correct stocking, over-stocking, under-stocking) and two of them are unacceptable in a production system. The most important aspect of Figure 5, however, illustrates the stocking rate at which maximum net return occurs. This generally takes place at a moderate stocking rate, or a compromise point between forage resource conservation and animal performance.
Moderate stocking rate will vary according to those forage species used in the specific production system. Producers who continually use heavy stocking rates in an attempt to improve net profitability, however, should realize that they have already passed the point at which maximum net return may be realized.
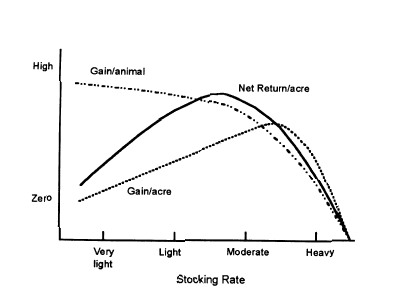
Figure 5. Influence of stocking rate on individual animal performance, gain per acre, and net return per acre.
Summary
Stocking rate is the key element to successful livestock production. The use of improper stocking rates can reduce both the vigor of desirable forage species and animal performance. This results in decreased profitability and sustainability of the production system.
Introduced forages generally have higher production potentials than native plant communities, but the increase comes at a cost for inputs associated with maintenance of soil fertility. There is some misunderstanding regarding potential profitability of introduced forage and native rangeland livestock production systems. Some people believe that because some introduced forages can generally be grazed more heavily than native rangeland, the profit is proportionally more. Introduced forages, however, if not managed wisely, can increase input costs, but the producer may realize little, if any, increased production or profitability when compared to native rangeland systems.
Different management techniques are required for introduced forages relative to native rangeland. Native rangeland can not be utilized to the same degree as introduced forages except under specialized conditions. It is critical that producers understand the forage resource under their control and stock livestock appropriately. For more information, contact your local county Cooperative Extension Agriculture Agent or obtain one of the following OSU Extension Publications.
PSS-2567 Grazing Systems for Pastures
PSS-2584 Forage-Budgeting Guidelines
PSS-2864 Grazing Forest-Rangeland in Eastern Oklahoma
NREM-5032 Lease Hunting Opportunities for Oklahoma Landowners
E-926 Grazing Management on Rangeland for Beef Production
E-927 Using Prescribed Fire in Oklahoma
Daren D. Redfearn
State Extension Forage Specialist
Terrence G. Bidwell
Professor and State Extension Specialist
Rangeland Ecology and Management